

Full report. - Social Research and Demonstration Corp
Full report. - Social Research and Demonstration Corp
Full report. - Social Research and Demonstration Corp

You also want an ePaper? Increase the reach of your titles
YUMPU automatically turns print PDFs into web optimized ePapers that Google loves.
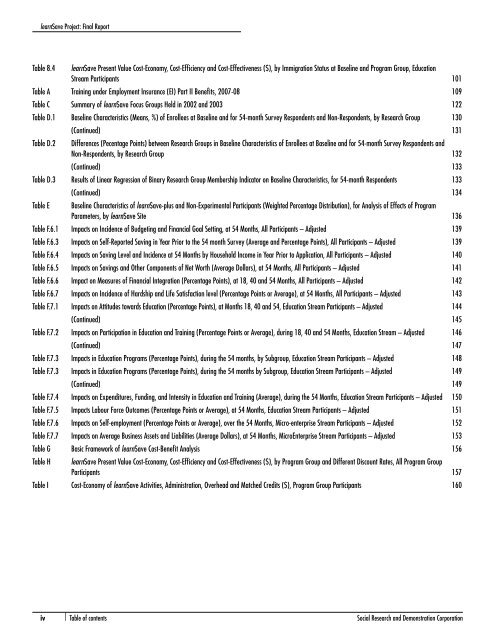
learn$ave Project: Final ReportTable 8.4 learn$ave Present Value Cost-Economy, Cost-Efficiency <strong>and</strong> Cost-Effectiveness ($), by Immigration Status at Baseline <strong>and</strong> Program Group, EducationStream Participants 101Table A Training under Employment Insurance (EI) Part II Benefits, 2007-08 109Table C Summary of learn$ave Focus Groups Held in 2002 <strong>and</strong> 2003 122Table D.1 Baseline Characteristics (Means, %) of Enrollees at Baseline <strong>and</strong> for 54-month Survey Respondents <strong>and</strong> Non-Respondents, by <strong>Research</strong> Group 130(Continued) 131Table D.2 Differences (Pecentage Points) between <strong>Research</strong> Groups in Baseline Characteristics of Enrollees at Baseline <strong>and</strong> for 54-month Survey Respondents <strong>and</strong>Non-Respondents, by <strong>Research</strong> Group 132(Continued) 133Table D.3 Results of Linear Regression of Binary <strong>Research</strong> Group Membership Indicator on Baseline Characteristics, for 54-month Respondents 133(Continued) 134Table E Baseline Characteristics of learn$ave-plus <strong>and</strong> Non-Experimental Participants (Weighted Percentage Distribution), for Analysis of Effects of ProgramParameters, by learn$ave Site 136Table F.6.1 Impacts on Incidence of Budgeting <strong>and</strong> Financial Goal Setting, at 54 Months, All Participants – Adjusted 139Table F.6.3 Impacts on Self-Reported Saving in Year Prior to the 54 month Survey (Average <strong>and</strong> Percentage Points), All Participants – Adjusted 139Table F.6.4 Impacts on Saving Level <strong>and</strong> Incidence at 54 Months by Household Income in Year Prior to Application, All Participants – Adjusted 140Table F.6.5 Impacts on Savings <strong>and</strong> Other Components of Net Worth (Average Dollars), at 54 Months, All Participants – Adjusted 141Table F.6.6 Impact on Measures of Financial Integration (Percentage Points), at 18, 40 <strong>and</strong> 54 Months, All Participants – Adjusted 142Table F.6.7 Impacts on Incidence of Hardship <strong>and</strong> Life Satisfaction level (Percentage Points or Average), at 54 Months, All Participants – Adjusted 143Table F.7.1 Impacts on Attitudes towards Education (Percentage Points), at Months 18, 40 <strong>and</strong> 54, Education Stream Participants – Adjusted 144(Continued) 145Table F.7.2 Impacts on Participation in Education <strong>and</strong> Training (Percentage Points or Average), during 18, 40 <strong>and</strong> 54 Months, Education Stream – Adjusted 146(Continued) 147Table F.7.3 Impacts in Education Programs (Percentage Points), during the 54 months, by Subgroup, Education Stream Participants – Adjusted 148Table F.7.3 Impacts in Education Programs (Percentage Points), during the 54 months by Subgroup, Education Stream Participants – Adjusted 149(Continued) 149Table F.7.4 Impacts on Expenditures, Funding, <strong>and</strong> Intensity in Education <strong>and</strong> Training (Average), during the 54 Months, Education Stream Participants – Adjusted 150Table F.7.5 Impacts Labour Force Outcomes (Percentage Points or Average), at 54 Months, Education Stream Participants – Adjusted 151Table F.7.6 Impacts on Self-employment (Percentage Points or Average), over the 54 Months, Micro-enterprise Stream Participants – Adjusted 152Table F.7.7 Impacts on Average Business Assets <strong>and</strong> Liabilities (Average Dollars), at 54 Months, MicroEnterprise Stream Participants – Adjusted 153Table G Basic Framework of learn$ave Cost-Benefit Analysis 156Table H learn$ave Present Value Cost-Economy, Cost-Efficiency <strong>and</strong> Cost-Effectiveness ($), by Program Group <strong>and</strong> Different Discount Rates, All Program GroupParticipants 157Table I Cost-Economy of learn$ave Activities, Administration, Overhead <strong>and</strong> Matched Credits ($), Program Group Participants 160iv | Table of contents <strong>Social</strong> <strong>Research</strong> <strong>and</strong> <strong>Demonstration</strong> <strong>Corp</strong>oration

