

Full report. - Social Research and Demonstration Corp
Full report. - Social Research and Demonstration Corp
Full report. - Social Research and Demonstration Corp

Create successful ePaper yourself
Turn your PDF publications into a flip-book with our unique Google optimized e-Paper software.
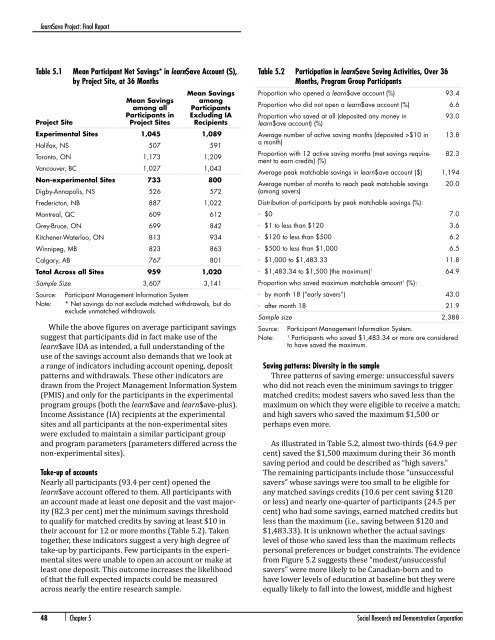
learn$ave Project: Final ReportTable 5.1 Mean Participant Net Savings* in learn$ave Account ($),by Project Site, at 36 MonthsProject SiteMean Savingsamong allParticipants inProject SitesMean SavingsamongParticipantsExcluding IARecipientsExperimental Sites 1,045 1,089Halifax, NS 507 591Toronto, ON 1,173 1,209Vancouver, BC 1,027 1,043Non-experimental Sites 733 800Digby-Annapolis, NS 526 572Fredericton, NB 887 1,022Montreal, QC 609 612Grey-Bruce, ON 699 842Kitchener-Waterloo, ON 813 934Winnipeg, MB 823 863Calgary, AB 767 801Total Across all Sites 959 1,020Sample Size 3,607 3,141Source:Note:Participant Management Information System* Net savings do not exclude matched withdrawals, but doexclude unmatched withdrawals.While the above figures on average participant savingssuggest that participants did in fact make use of thelearn$ave IDA as intended, a full underst<strong>and</strong>ing of theuse of the savings account also dem<strong>and</strong>s that we look ata range of indicators including account opening, depositpatterns <strong>and</strong> withdrawals. These other indicators aredrawn from the Project Management Information System(PMIS) <strong>and</strong> only for the participants in the experimentalprogram groups (both the learn$ave <strong>and</strong> learn$ave-plus).Income Assistance (IA) recipients at the experimentalsites <strong>and</strong> all participants at the non-experimental siteswere excluded to maintain a similar participant group<strong>and</strong> program parameters (parameters differed across thenon-experimental sites).Take-up of accountsNearly all participants (93.4 per cent) opened thelearn$ave account offered to them. All participants withan account made at least one deposit <strong>and</strong> the vast majority(82.3 per cent) met the minimum savings thresholdto qualify for matched credits by saving at least $10 intheir account for 12 or more months (Table 5.2). Takentogether, these indicators suggest a very high degree oftake-up by participants. Few participants in the experimentalsites were unable to open an account or make atleast one deposit. This outcome increases the likelihoodof that the full expected impacts could be measuredacross nearly the entire research sample.Table 5.2 Participation in learn$ave Saving Activities, Over 36Months, Program Group ParticipantsProportion who opened a learn$ave account (%) 93.4Proportion who did not open a learn$ave account (%) 6.6Proportion who saved at all (deposited any money inlearn$ave account) (%)Average number of active saving months (deposited >$10 ina month)Proportion with 12 active saving months (met savings requirementto earn credits) (%)93.013.882.3Average peak matchable savings in learn$ave account ($) 1,194Average number of months to reach peak matchable savings(among savers)Distribution of participants by peak matchable savings (%):20.0▪ ▪ $0 7.0▪ ▪ $1 to less than $120 3.6▪ ▪ $120 to less than $500 6.2▪ ▪ $500 to less than $1,000 6.5▪ ▪ $1,000 to $1,483.33 11.8▪ ▪ $1,483.34 to $1,500 (the maximum) 1 64.9Proportion who saved maximum matchable amount 1 (%):▪▪by month 18 (“early savers”) 43.0▪▪after month 18 21.9Sample size 2,388Source:Note:Participant Management Information System.1Participants who saved $1,483.34 or more are consideredto have saved the maximum.Saving patterns: Diversity in the sampleThree patterns of saving emerge: unsuccessful saverswho did not reach even the minimum savings to triggermatched credits; modest savers who saved less than themaximum on which they were eligible to receive a match;<strong>and</strong> high savers who saved the maximum $1,500 orperhaps even more.As illustrated in Table 5.2, almost two-thirds (64.9 percent) saved the $1,500 maximum during their 36 monthsaving period <strong>and</strong> could be described as “high savers.”The remaining participants include those “unsuccessfulsavers” whose savings were too small to be eligible forany matched savings credits (10.6 per cent saving $120or less) <strong>and</strong> nearly one-quarter of participants (24.5 percent) who had some savings, earned matched credits butless than the maximum (i.e., saving between $120 <strong>and</strong>$1,483.33). It is unknown whether the actual savingslevel of those who saved less than the maximum reflectspersonal preferences or budget constraints. The evidencefrom Figure 5.2 suggests these “modest/unsuccessfulsavers” were more likely to be Canadian-born <strong>and</strong> tohave lower levels of education at baseline but they wereequally likely to fall into the lowest, middle <strong>and</strong> highest48 | Chapter 5 <strong>Social</strong> <strong>Research</strong> <strong>and</strong> <strong>Demonstration</strong> <strong>Corp</strong>oration

