

Full report. - Social Research and Demonstration Corp
Full report. - Social Research and Demonstration Corp
Full report. - Social Research and Demonstration Corp

Create successful ePaper yourself
Turn your PDF publications into a flip-book with our unique Google optimized e-Paper software.
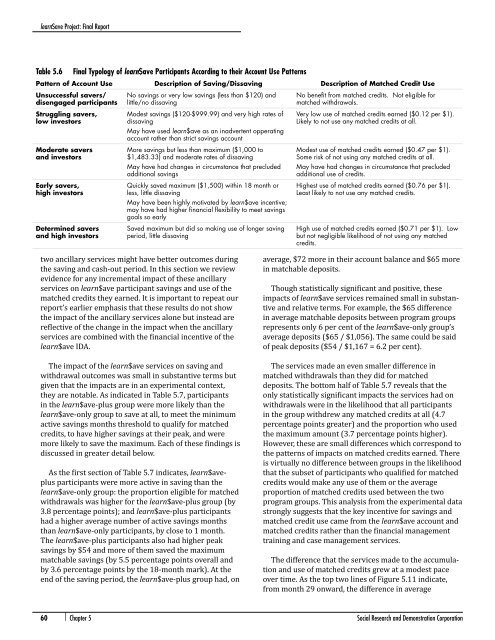
learn$ave Project: Final ReportTable 5.6 Final Typology of learn$ave Participants According to their Account Use PatternsPattern of Account Use Description of Saving/Dissaving Description of Matched Credit UseUnsuccessful savers/disengaged participantsStruggling savers,low investorsModerate savers<strong>and</strong> investorsEarly savers,high investorsDetermined savers<strong>and</strong> high investorsNo savings or very low savings (less than $120) <strong>and</strong>little/no dissavingModest savings ($120-$999.99) <strong>and</strong> very high rates ofdissavingMay have used learn$ave as an inadvertent opperatingaccount rather than strict savings accountMore savings but less than maximum ($1,000 to$1,483.33) <strong>and</strong> moderate rates of dissavingMay have had changes in circumstance that precludedadditional savingsQuickly saved maximum ($1,500) within 18 month orless, little dissavingMay have been highly motivated by learn$ave incentive;may have had higher financial flexibility to meet savingsgoals so earlySaved maximum but did so making use of longer savingperiod, little dissavingNo benefit from matched credits. Not eligible formatched withdrawals.Very low use of matched credits earned ($0.12 per $1).Likely to not use any matched credits at all.Modest use of matched credits earned ($0.47 per $1).Some risk of not using any matched credits at all.May have had changes in circumstance that precludedadditional use of credits.Highest use of matched credits earned ($0.76 per $1).Least likely to not use any matched credits.High use of matched credits earned ($0.71 per $1). Lowbut not negligible likelihood of not using any matchedcredits.two ancillary services might have better outcomes duringthe saving <strong>and</strong> cash-out period. In this section we reviewevidence for any incremental impact of these ancillaryservices on learn$ave participant savings <strong>and</strong> use of thematched credits they earned. It is important to repeat our<strong>report</strong>’s earlier emphasis that these results do not showthe impact of the ancillary services alone but instead arereflective of the change in the impact when the ancillaryservices are combined with the financial incentive of thelearn$ave IDA.The impact of the learn$ave services on saving <strong>and</strong>withdrawal outcomes was small in substantive terms butgiven that the impacts are in an experimental context,they are notable. As indicated in Table 5.7, participantsin the learn$ave-plus group were more likely than thelearn$ave-only group to save at all, to meet the minimumactive savings months threshold to qualify for matchedcredits, to have higher savings at their peak, <strong>and</strong> weremore likely to save the maximum. Each of these findings isdiscussed in greater detail below.As the first section of Table 5.7 indicates, learn$aveplusparticipants were more active in saving than thelearn$ave-only group: the proportion eligible for matchedwithdrawals was higher for the learn$ave-plus group (by3.8 percentage points); <strong>and</strong> learn$ave-plus participantshad a higher average number of active savings monthsthan learn$ave-only participants, by close to 1 month.The learn$ave-plus participants also had higher peaksavings by $54 <strong>and</strong> more of them saved the maximummatchable savings (by 5.5 percentage points overall <strong>and</strong>by 3.6 percentage points by the 18-month mark). At theend of the saving period, the learn$ave-plus group had, onaverage, $72 more in their account balance <strong>and</strong> $65 morein matchable deposits.Though statistically significant <strong>and</strong> positive, theseimpacts of learn$ave services remained small in substantive<strong>and</strong> relative terms. For example, the $65 differencein average matchable deposits between program groupsrepresents only 6 per cent of the learn$ave-only group’saverage deposits ($65 / $1,056). The same could be saidof peak deposits ($54 / $1,167 = 6.2 per cent).The services made an even smaller difference inmatched withdrawals than they did for matcheddeposits. The bottom half of Table 5.7 reveals that theonly statistically significant impacts the services had onwithdrawals were in the likelihood that all participantsin the group withdrew any matched credits at all (4.7percentage points greater) <strong>and</strong> the proportion who usedthe maximum amount (3.7 percentage points higher).However, these are small differences which correspond tothe patterns of impacts on matched credits earned. Thereis virtually no difference between groups in the likelihoodthat the subset of participants who qualified for matchedcredits would make any use of them or the averageproportion of matched credits used between the twoprogram groups. This analysis from the experimental datastrongly suggests that the key incentive for savings <strong>and</strong>matched credit use came from the learn$ave account <strong>and</strong>matched credits rather than the financial managementtraining <strong>and</strong> case management services.The difference that the services made to the accumulation<strong>and</strong> use of matched credits grew at a modest paceover time. As the top two lines of Figure 5.11 indicate,from month 29 onward, the difference in average60 | Chapter 5 <strong>Social</strong> <strong>Research</strong> <strong>and</strong> <strong>Demonstration</strong> <strong>Corp</strong>oration

