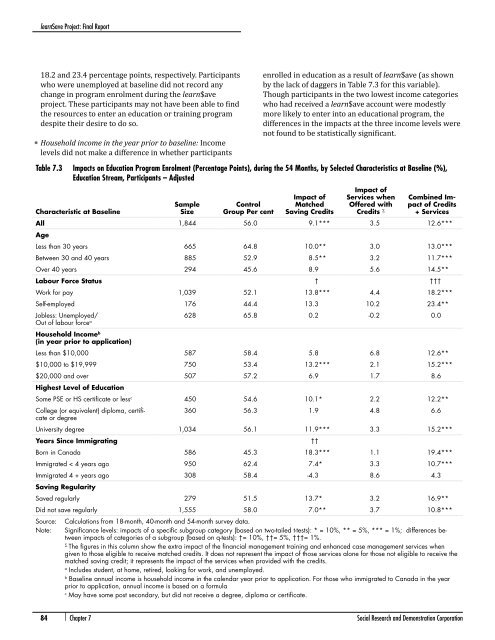
learn$ave Project: Final Report18.2 <strong>and</strong> 23.4 percentage points, respectively. Participantswho were unemployed at baseline did not record anychange in program enrolment during the learn$aveproject. These participants may not have been able to findthe resources to enter an education or training programdespite their desire to do so.• Household income in the year prior to baseline: Incomelevels did not make a difference in whether participantsenrolled in education as a result of learn$ave (as shownby the lack of daggers in Table 7.3 for this variable).Though participants in the two lowest income categorieswho had received a learn$ave account were modestlymore likely to enter into an educational program, thedifferences in the impacts at the three income levels werenot found to be statistically significant.Table 7.3 Impacts on Education Program Enrolment (Percentage Points), during the 54 Months, by Selected Characteristics at Baseline (%),Education Stream, Participants – AdjustedCharacteristic at BaselineSampleSizeControlGroup Per centImpact ofMatchedSaving CreditsImpact ofServices whenOffered withCredits ∑Combined Impactof Credits+ ServicesAll 1,844 56.0 9.1*** 3.5 12.6***AgeLess than 30 years 665 64.8 10.0** 3.0 13.0***Between 30 <strong>and</strong> 40 years 885 52.9 8.5** 3.2 11.7***Over 40 years 294 45.6 8.9 5.6 14.5**Labour Force Status † †††Work for pay 1,039 52.1 13.8*** 4.4 18.2***Self-employed 176 44.4 13.3 10.2 23.4**Jobless: Unemployed/Out of labour force a 628 65.8 0.2 -0.2 0.0Household Income b(in year prior to application)Less than $10,000 587 58.4 5.8 6.8 12.6**$10,000 to $19,999 750 53.4 13.2*** 2.1 15.2***$20,000 <strong>and</strong> over 507 57.2 6.9 1.7 8.6Highest Level of EducationSome PSE or HS certificate or less c 450 54.6 10.1* 2.2 12.2**College (or equivalent) diploma, certificateor degree360 56.3 1.9 4.8 6.6University degree 1,034 56.1 11.9*** 3.3 15.2***Years Since Immigrating ††Born in Canada 586 45.3 18.3*** 1.1 19.4***Immigrated < 4 years ago 950 62.4 7.4* 3.3 10.7***Immigrated 4 + years ago 308 58.4 -4.3 8.6 4.3Saving RegularitySaved regularly 279 51.5 13.7* 3.2 16.9**Did not save regularly 1,555 58.0 7.0** 3.7 10.8***Source: Calculations from 18-month, 40-month <strong>and</strong> 54-month survey data.Note: Significance levels: impacts of a specific subgroup category (based on two-tailed t-tests): * = 10%, ** = 5%, *** = 1%; differences betweenimpacts of categories of a subgroup (based on q-tests): †= 10%, ††= 5%, †††= 1%.∑The figures in this column show the extra impact of the financial management training <strong>and</strong> enhanced case management services whengiven to those eligible to receive matched credits. It does not represent the impact of those services alone for those not eligible to receive thematched saving credit; it represents the impact of the services when provided with the credits.aIncludes student, at home, retired, looking for work, <strong>and</strong> unemployed.bBaseline annual income is household income in the calendar year prior to application. For those who immigrated to Canada in the yearprior to application, annual income is based on a formulacMay have some post secondary, but did not receive a degree, diploma or certificate.84 | Chapter 7 <strong>Social</strong> <strong>Research</strong> <strong>and</strong> <strong>Demonstration</strong> <strong>Corp</strong>oration
learn$ave Project: Final Report• Education attainment level at baseline: Prior educationdid not make much of a difference in learn$ave impactson education program enrolment. The education programenrolment rate of control group members was similaracross all levels of baseline educational attainment(55–56 per cent), <strong>and</strong> there was no statistical differencein the impacts of learn$ave at different education levels.Still, it is notable that program group (both learn$ave only<strong>and</strong> learn$ave-plus) participants at the lowest level ofeducation (those with no PSE certification) demonstratedan important increase (10.1 <strong>and</strong> 12.2 percent percentagepoints) in education program participation compared tothe control group. Not only would those participants havethe most to gain from further education, but, as discussedin Chapter 1, prior education has been shown to be astrong predictor of future participation in education <strong>and</strong>learn$ave may have had some impact in changing thistrend.• Immigration status at baseline: Immigration status wasa factor in the education program impacts (as indicatedby daggers in Table 7.3). Those who had immigrated toCanada four or more years prior to entering the projectwere no more likely to enrol in education as a result oflearn$ave than those in the control group. Among newimmigrants, who represent about half the participantsin the experimental sample, participation in educationdid rise (10.7 percent) as a result of learn$ave. However,compared to similar participants in the control group,Canadian-born participants in the project dramaticallyincreased their participation in education when theyreceived the learn$ave-plus or learn$ave-only program,by 18.3 percentage points <strong>and</strong> 19.4 percentage points,respectively.It is worth noting that recent immigrants had thehighest rate of education participation in the controlgroup (62.4 percent compared to 56 percent for thecontrol group as a whole). Given the overlap between newimmigrants <strong>and</strong> university degree holders in the sample,a new bivariate subgroup variable was created: educationinteracted with immigrant status. It was hypothesizedearlier that that perhaps a large number of highly educatedimmigrants were using learn$ave to accredit prioreducation obtained abroad. However, while the impactsfor immigrant degree-holders were significant, they werejust barely so, <strong>and</strong> the impacts were not as large as theywere for Canadian-born participants, with a BA or not(not shown in table). This suggests that immigrants werenot necessarily using learn$ave to “Canadianize” theirforeign PSE credentials.• Saving regularly at baseline: As regular savers areexpected to have a strong orientation toward the future,they should be more inclined to treat education as aninvestment than non regular savers. However, howregularly one saved at baseline did not affect educationenrolment in learn$ave. While, regular savers weremore likely to benefit from learn$ave (16.9 versus 10.8percentage points for non-regular savers), this differencewas not significant in statistical terms (as indicated by thelack of daggers in the table). 3 Nonetheless, these resultsdo show that non-savers can be induced to save <strong>and</strong> enrolin education or training programs.Impacts on education <strong>and</strong> training spending <strong>and</strong> intensityThe research was concerned not only with measuringimpacts on education enrolment but also on how muchparticipants spent on education, how they funded it, <strong>and</strong>how much time they invested in it. Estimates of each ofthese impacts are presented in Table 7.4 for all educationstream participants. Note that these are education expendituresfunded from all sources, including participants’own funds.Both learn$ave matched credits, alone <strong>and</strong> combinedwith the services, resulted in participants spending moreon education <strong>and</strong> training, particularly in programs ratherthan courses. Over the 54-month period, the learn$avecredits <strong>and</strong> services together led learn$ave-plus participantsto spend, on average, $2,142 more on educationprograms leading to PSE certification compared to thecontrol group. This total included $1,968 in tuition <strong>and</strong>$173 in books. The impact was derived not only from thematched credit incentives alone, as the addition of theservices contributed an additional $918 to the overall$2,142 increase in individual spending on education.Though the learn$ave financial management training <strong>and</strong>enhanced case management services did not have muchincremental impact with regard to education enrolmenton top of the effect of the credits, the positive impactson educational expenditures imply that the services mayhave encouraged members of the learn$ave-plus group toseek out education with greater earnings potential, whichtends to be more costly.As noted, these are educational expenditures fundedby all sources, including the matched saving credits. Anargument could be made for not including this grant towhich the control group did not have access. Indeed,subtracting the average matched saving credits used bythe learn$ave-only <strong>and</strong> learn$ave-plus groups ($2,342<strong>and</strong> $2,529, respectively; Chapter 5) would eliminate theimpact on educational expenditures.3 Despite their statistical significance, the estimated impacts should be interpreted with somecaution based as they are on a small non-r<strong>and</strong>om sample of those who were regular savers atbaseline (n=279).<strong>Social</strong> <strong>Research</strong> <strong>and</strong> <strong>Demonstration</strong> <strong>Corp</strong>oration Chapter 7 | 85