- Page 1 and 2:
3PrefaceThe research presented in t
- Page 3 and 4:
5Table of contentsPART 1 ..........
- Page 5 and 6:
7Summary/abstractThe work reported
- Page 8 and 9:
101 IntroductionProjects are increa
- Page 10:
collection and interpretation of th
- Page 13 and 14:
15normative agendas, in other words
- Page 15 and 16:
17world of projects. The choice of
- Page 17 and 18:
19Figure 3 Sources and dataThe proj
- Page 19 and 20:
21In line with Flyvbjerg (2006b), t
- Page 21 and 22:
233 Concepts and constructs of thep
- Page 23 and 24:
25by most BOKs and textbooks in pro
- Page 25 and 26:
274 Main topics covered by the rese
- Page 27 and 28:
294.2 Empirical indications from ex
- Page 29 and 30:
31Budget proposed by the Norwegian
- Page 31 and 32:
3330 %Difference (%) from the propo
- Page 33 and 34:
3520 00018 000Cost development from
- Page 35 and 36:
37In paper 9 (Magnussen 2009a) an a
- Page 37 and 38:
395 Conclusions and directions for
- Page 39 and 40:
41estimates must be implemented at
- Page 41 and 42:
43Klakegg, Ole Jonny, Terry William
- Page 43 and 44:
45List of government documents 11Fi
- Page 45 and 46:
47Part 2 - Papers1. Magnussen, Ole
- Page 47 and 48:
Paper 1Magnussen, Ole Morten, and K
- Page 49 and 50:
AbstractCost overruns and delays ar
- Page 51 and 52:
Cost effectiveness considerations:
- Page 53 and 54:
demonstrates another fundamental is
- Page 55 and 56:
Figure 1 The Extended Quality Assur
- Page 57 and 58:
Expected effects of the revised qua
- Page 59 and 60:
ReferencesBerg, Peder, Kilde, Halva
- Page 61 and 62:
International Journal of Project Ma
- Page 63 and 64:
O.M. Magnussen, N.O.E. Olsson / Int
- Page 65 and 66:
O.M. Magnussen, N.O.E. Olsson / Int
- Page 67 and 68:
O.M. Magnussen, N.O.E. Olsson / Int
- Page 69 and 70:
Paper 3Magnussen, Ole M., and Nils
- Page 71 and 72:
MANAGING THE FRONT-END OF PROJECTS:
- Page 73 and 74:
Olsson, Samset, Austeng and Lädre
- Page 75 and 76:
1995; Packendorff, 1995), mainly cr
- Page 77 and 78:
to a better way of managing the fro
- Page 79 and 80:
Figure 1 Basic structure of the ind
- Page 81 and 82:
from empirical investigations has b
- Page 83 and 84:
among organizations, not individual
- Page 85 and 86:
actors, the relationships are repro
- Page 87 and 88:
the network approach has been used
- Page 89 and 90:
established based on the views of i
- Page 91 and 92:
IHFJKGAELDMBCA - The focal projectB
- Page 93 and 94:
the NDEA. The communication strateg
- Page 95 and 96:
Directorate for Cultural Heritage (
- Page 97 and 98:
the project. The basic activity was
- Page 99 and 100:
assumed to be more important than o
- Page 101 and 102:
Another interesting observation was
- Page 103 and 104:
REFERENCESEngwall, Mats. 2003. No p
- Page 105 and 106:
Söderlund, Jonas. 2002. On the dev
- Page 107 and 108:
Flexibility at Different Stages in
- Page 109 and 110:
Reproduced with permission of the c
- Page 111 and 112:
Reproduced with permission of the c
- Page 113 and 114:
Reproduced with permission of the c
- Page 115:
Paper 5Olsson, Nils O. E., and Ole
- Page 126 and 127: PAPERSGovernance Frameworks for Pub
- Page 128 and 129: supporting setting of and achieving
- Page 130 and 131: The study proceeded as follows:•
- Page 132 and 133: y the Chief of Defence Materiel, he
- Page 134 and 135: (within MoD but independent of thep
- Page 136 and 137: Norway U.K. (MoD) U.K. (OGC)Charact
- Page 138 and 139: from the external consultants was s
- Page 140 and 141: governance. International StudiesRe
- Page 142 and 143: Paper 7Williams, Terry, Ole Jonny K
- Page 144 and 145: The development of the frameworksUK
- Page 146 and 147: notable characteristic of the Norwe
- Page 148 and 149: Office to the National Audit Office
- Page 150 and 151: highly complex and changing decisio
- Page 152 and 153: ARTICLE IN PRESSAvailable online at
- Page 154 and 155: ARTICLE IN PRESST. Williams et al.
- Page 156 and 157: ARTICLE IN PRESST. Williams et al.
- Page 158 and 159: ARTICLE IN PRESST. Williams et al.
- Page 160 and 161: ARTICLE IN PRESST. Williams et al.
- Page 162 and 163: ARTICLE IN PRESST. Williams et al.
- Page 164 and 165: Paper submitted to the Internationa
- Page 166 and 167: One constraint is that actual costs
- Page 168 and 169: In other words, the QA scheme is a
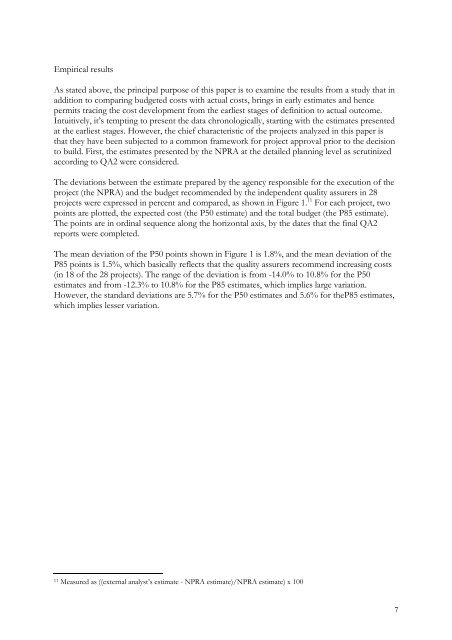
- Page 172 and 173: 20,0 %15,0 %10,0 %5,0 %0,0 %P50 est
- Page 174 and 175: The pre-eminent result is that the
- Page 176 and 177: Results from the analysis of the de
- Page 178 and 179: more fundamental assessments of pro
- Page 180 and 181: Paper 10Magnussen, Ole M. 2009. Exp
- Page 182 and 183: Explaining cost estimate difference
- Page 184 and 185: changes and external factors. Facto
- Page 186 and 187: 30 %Difference (%) from the propose
- Page 188 and 189: Table 2 Areas associated with expla
- Page 190 and 191: agency. In this case, the observed
- Page 192 and 193: ReferencesFlyvbjerg, B., Holm, M.K.