Link to thesis. - Concept - NTNU
Link to thesis. - Concept - NTNU
Link to thesis. - Concept - NTNU
- No tags were found...

Create successful ePaper yourself
Turn your PDF publications into a flip-book with our unique Google optimized e-Paper software.
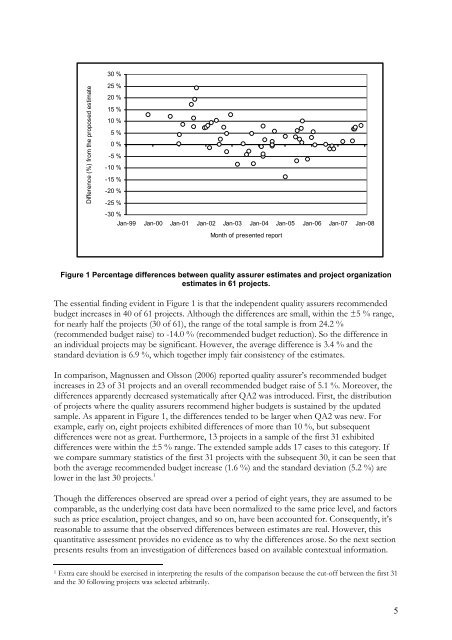
30 %Difference (%) from the proposed estimate25 %20 %15 %10 %5 %0 %-5 %-10 %-15 %-20 %-25 %-30 %Jan-99 Jan-00 Jan-01 Jan-02 Jan-03 Jan-04 Jan-05 Jan-06 Jan-07 Jan-08Month of presented reportFigure 1 Percentage differences between quality assurer estimates and project organizationestimates in 61 projects.The essential finding evident in Figure 1 is that the independent quality assurers recommendedbudget increases in 40 of 61 projects. Although the differences are small, within the ±5 % range,for nearly half the projects (30 of 61), the range of the <strong>to</strong>tal sample is from 24.2 %(recommended budget raise) <strong>to</strong> -14.0 % (recommended budget reduction). So the difference inan individual projects may be significant. However, the average difference is 3.4 % and thestandard deviation is 6.9 %, which <strong>to</strong>gether imply fair consistency of the estimates.In comparison, Magnussen and Olsson (2006) reported quality assurer’s recommended budgetincreases in 23 of 31 projects and an overall recommended budget raise of 5.1 %. Moreover, thedifferences apparently decreased systematically after QA2 was introduced. First, the distributionof projects where the quality assurers recommend higher budgets is sustained by the updatedsample. As apparent in Figure 1, the differences tended <strong>to</strong> be larger when QA2 was new. Forexample, early on, eight projects exhibited differences of more than 10 %, but subsequentdifferences were not as great. Furthermore, 13 projects in a sample of the first 31 exhibiteddifferences were within the ±5 % range. The extended sample adds 17 cases <strong>to</strong> this category. Ifwe compare summary statistics of the first 31 projects with the subsequent 30, it can be seen thatboth the average recommended budget increase (1.6 %) and the standard deviation (5.2 %) arelower in the last 30 projects. 1Though the differences observed are spread over a period of eight years, they are assumed <strong>to</strong> becomparable, as the underlying cost data have been normalized <strong>to</strong> the same price level, and fac<strong>to</strong>rssuch as price escalation, project changes, and so on, have been accounted for. Consequently, it’sreasonable <strong>to</strong> assume that the observed differences between estimates are real. However, thisquantitative assessment provides no evidence as <strong>to</strong> why the differences arose. So the next sectionpresents results from an investigation of differences based on available contextual information.1 Extra care should be exercised in interpreting the results of the comparison because the cut-off between the first 31and the 30 following projects was selected arbitrarily.5