Link to thesis. - Concept - NTNU
Link to thesis. - Concept - NTNU
Link to thesis. - Concept - NTNU
- No tags were found...

You also want an ePaper? Increase the reach of your titles
YUMPU automatically turns print PDFs into web optimized ePapers that Google loves.
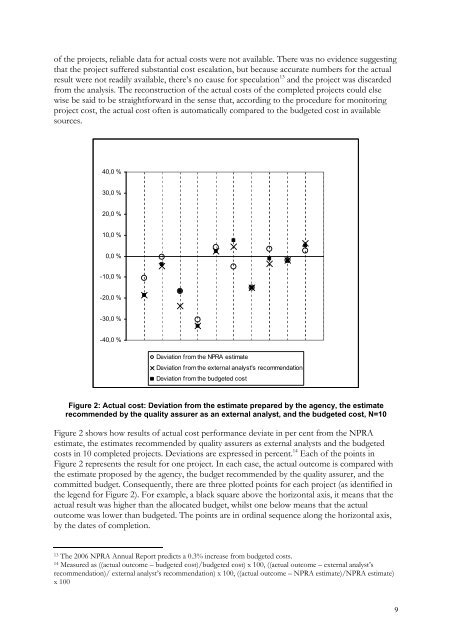
of the projects, reliable data for actual costs were not available. There was no evidence suggestingthat the project suffered substantial cost escalation, but because accurate numbers for the actualresult were not readily available, there’s no cause for speculation 13 and the project was discardedfrom the analysis. The reconstruction of the actual costs of the completed projects could elsewise be said <strong>to</strong> be straightforward in the sense that, according <strong>to</strong> the procedure for moni<strong>to</strong>ringproject cost, the actual cost often is au<strong>to</strong>matically compared <strong>to</strong> the budgeted cost in availablesources.40,0 %30,0 %20,0 %10,0 %0,0 %-10,0 %-20,0 %-30,0 %-40,0 %Deviation from the NPRA estimateDeviation from the external analyst's recommendationDeviation from the budgeted costFigure 2: Actual cost: Deviation from the estimate prepared by the agency, the estimaterecommended by the quality assurer as an external analyst, and the budgeted cost, N=10Figure 2 shows how results of actual cost performance deviate in per cent from the NPRAestimate, the estimates recommended by quality assurers as external analysts and the budgetedcosts in 10 completed projects. Deviations are expressed in percent. 14 Each of the points inFigure 2 represents the result for one project. In each case, the actual outcome is compared withthe estimate proposed by the agency, the budget recommended by the quality assurer, and thecommitted budget. Consequently, there are three plotted points for each project (as identified inthe legend for Figure 2). For example, a black square above the horizontal axis, it means that theactual result was higher than the allocated budget, whilst one below means that the actualoutcome was lower than budgeted. The points are in ordinal sequence along the horizontal axis,by the dates of completion.13 The 2006 NPRA Annual Report predicts a 0.3% increase from budgeted costs.14 Measured as ((actual outcome – budgeted cost)/budgeted cost) x 100, ((actual outcome – external analyst’srecommendation)/ external analyst’s recommendation) x 100, ((actual outcome – NPRA estimate)/NPRA estimate)x 1009