284 O.M. Magnussen, N.O.E. Olsson / International Journal of Project Management 24 (2006) 281–288tion technique is the so-called judgmental forecasting andthe forecast serves the purpose of predicting the future fac<strong>to</strong>rsthat may influence project costs. A statistical modelwhere it is assumed that the uncertainty is normally distributedis used [3]. The proposed budget for the project, preparedby the project organisation before the qualityassurance takes place, pertains in most cases <strong>to</strong> the 50%subjective probability, i.e., there is a 50% expected probabilitythat the project will be completed within this cost.The recommendation from the external consultant consistsof the expected cost and <strong>to</strong>tal budget, most often based on50% and 85% probability, respectively. The uncertaintyanalyses performed by the project organisation and theexternal consultant represent the basis when the projec<strong>to</strong>wner decides upon the estimates that are <strong>to</strong> be presentedin the national budget or in a separate project-specific Governmentwhite paper. Formally, the Parliament reacheswhatever conclusion on the matter it would find appropriate.In practice, however, the estimates presented in thenational budget or the project-specific white papers aresanctioned by Parliament without changes.4.4. The new approach <strong>to</strong> project costsOlsson et al. [9] describe the situation that, as a consequenceof the Quality-at-entry Regime, a more sophisticatedoverview of the project cost is presented. Theexternal consultant recommends a <strong>to</strong>tal budget that isexpected <strong>to</strong> cover the consequences of the identified uncertainties.The reserves are, however, not expected <strong>to</strong> be used,and specific rules for the management of reserves have beenestablished. The budget allocated <strong>to</strong> the executing governmentagency is the basic budget plus expected extra costs(based on 50% subjective probability), which also was thetypical standard before the Quality-at-entry Regime wasestablished. Use of the reserves must be approved by theresponsible ministry. This implies that there is a bindingupper financial level for the projects and a new controlscheme for budget compliance. Olsson et al. [9] point outthe need for management of project reserves for portfoliosof projects since a project owner often deal with manymajor projects at the same time. If this succeeds, it isexpected that the new approach will reduce the need foradditional funding and result in increased reliability ofthe cost estimate. Attempts <strong>to</strong> summarise some of theeffects of quality assurance suggest that:‘‘The involved ministries, being projects owners, haveexpressed a general satisfaction with the analyses, since theygive a ‘‘second opinion’’ of the projects. They also feel thatthey get a better basis <strong>to</strong> prepare the decision proposal forthe Norwegian parliament.’’ [9, p. 38]The new approach also raises some concerns. Olssonet al. [9] refer <strong>to</strong> the situation that some projects maybecome more expensive as a result of the allocated reserves.Planned use of the reserves could occur, and this couldenhance the observed tendency that projects at least filltheir allocated budget. Some claim that costs might soarbecause of the situation that the external consultants haveno responsibility for the actual budget. They recommend abudget, but have no role in the execution of the project.This could lead <strong>to</strong> a situation where the external consultantssystematically exaggerate the recommended <strong>to</strong>talbudget in order <strong>to</strong> reduce the risk that cost overruns couldoccur. On the other hand, if cost elements are omitted inthe initial estimates, quality assurance is designed <strong>to</strong> intervene,and in this respect have a rather direct impact on thecost estimation process.5. Data collection and refinementThe quality assurance report, which is a compilation ofthe results from quality assurance, represents the fundamentaldata source in our research. From the qualityassurance report it is possible <strong>to</strong> obtain cost estimates preparedby the project organisation/the executing governmentagency and of course the recommendation from theexternal consultant. The project budget approved by theParliament is obtainable from the national budget or project-specificGovernment white paper presented by theresponsible ministry. When it was deemed <strong>to</strong> be necessary<strong>to</strong> ensure the quality of the data, projects were contactedseparately via e-mail.To compare the cost estimates presented at the specificpoints in the process (cf. Fig. 1), cost data had <strong>to</strong> be correctedfor inflation. This basically means that cost data ineach individual project are brought <strong>to</strong> the same price levelas the approved budget, either with the aid of specific methodsfor the single project, or by appropriate indices fordiscounting.Before a presentation of the important findings fromanalyses done on the existing material, it should be notedthat the aim of this paper is not <strong>to</strong> present a final evaluationof the effects of the quality assurance scheme, sincemost of the projects are still in the planning stages or inthe early stages of implementation.6. Presentation of important findingsThe collected data are s<strong>to</strong>red in a research database.Proper s<strong>to</strong>rage and the possibilities for fast retrieval oflarge quantities of data seem <strong>to</strong> be the most importantcharacteristics of a database [13]. Fifty-two projects havebeen through the quality assurance procedure between2000 and 2004. On the basis of these projects a sample of31 projects representing a broad range of project typeswas established (cf. Table 1).6.1. The external consultantÕs recommended budget – projectreservesIn this section a closer look at the recommendation ofthe external consultant is presented. A special interest isconnected <strong>to</strong> the size of the reserve. The allocation of pro-
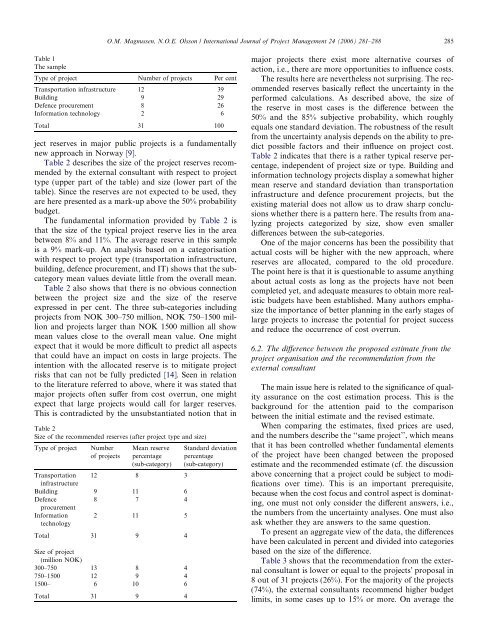
O.M. Magnussen, N.O.E. Olsson / International Journal of Project Management 24 (2006) 281–288 285Table 1The sampleType of project Number of projects Per centTransportation infrastructure 12 39Building 9 29Defence procurement 8 26Information technology 2 6Total 31 100ject reserves in major public projects is a fundamentallynew approach in Norway [9].Table 2 describes the size of the project reserves recommendedby the external consultant with respect <strong>to</strong> projecttype (upper part of the table) and size (lower part of thetable). Since the reserves are not expected <strong>to</strong> be used, theyare here presented as a mark-up above the 50% probabilitybudget.The fundamental information provided by Table 2 isthat the size of the typical project reserve lies in the areabetween 8% and 11%. The average reserve in this sampleis a 9% mark-up. An analysis based on a categorisationwith respect <strong>to</strong> project type (transportation infrastructure,building, defence procurement, and IT) shows that the subcategorymean values deviate little from the overall mean.Table 2 also shows that there is no obvious connectionbetween the project size and the size of the reserveexpressed in per cent. The three sub-categories includingprojects from NOK 300–750 million, NOK 750–1500 millionand projects larger than NOK 1500 million all showmean values close <strong>to</strong> the overall mean value. One mightexpect that it would be more difficult <strong>to</strong> predict all aspectsthat could have an impact on costs in large projects. Theintention with the allocated reserve is <strong>to</strong> mitigate projectrisks that can not be fully predicted [14]. Seen in relation<strong>to</strong> the literature referred <strong>to</strong> above, where it was stated thatmajor projects often suffer from cost overrun, one mightexpect that large projects would call for larger reserves.This is contradicted by the unsubstantiated notion that inTable 2Size of the recommended reserves (after project type and size)Type of projectNumberof projectsMean reservepercentage(sub-category)Transportation 12 8 3infrastructureBuilding 9 11 6Defence8 7 4procurementInformationtechnology2 11 5Total 31 9 4Size of project(million NOK)300–750 13 8 4750–1500 12 9 41500– 6 10 6Total 31 9 4Standard deviationpercentage(sub-category)major projects there exist more alternative courses ofaction, i.e., there are more opportunities <strong>to</strong> influence costs.The results here are nevertheless not surprising. The recommendedreserves basically reflect the uncertainty in theperformed calculations. As described above, the size ofthe reserve in most cases is the difference between the50% and the 85% subjective probability, which roughlyequals one standard deviation. The robustness of the resultfrom the uncertainty analysis depends on the ability <strong>to</strong> predictpossible fac<strong>to</strong>rs and their influence on project cost.Table 2 indicates that there is a rather typical reserve percentage,independent of project size or type. Building andinformation technology projects display a somewhat highermean reserve and standard deviation than transportationinfrastructure and defence procurement projects, but theexisting material does not allow us <strong>to</strong> draw sharp conclusionswhether there is a pattern here. The results from analyzingprojects categorized by size, show even smallerdifferences between the sub-categories.One of the major concerns has been the possibility thatactual costs will be higher with the new approach, wherereserves are allocated, compared <strong>to</strong> the old procedure.The point here is that it is questionable <strong>to</strong> assume anythingabout actual costs as long as the projects have not beencompleted yet, and adequate measures <strong>to</strong> obtain more realisticbudgets have been established. Many authors emphasizethe importance of better planning in the early stages oflarge projects <strong>to</strong> increase the potential for project successand reduce the occurrence of cost overrun.6.2. The difference between the proposed estimate from theproject organisation and the recommendation from theexternal consultantThe main issue here is related <strong>to</strong> the significance of qualityassurance on the cost estimation process. This is thebackground for the attention paid <strong>to</strong> the comparisonbetween the initial estimate and the revised estimate.When comparing the estimates, fixed prices are used,and the numbers describe the ‘‘same project’’, which meansthat it has been controlled whether fundamental elementsof the project have been changed between the proposedestimate and the recommended estimate (cf. the discussionabove concerning that a project could be subject <strong>to</strong> modificationsover time). This is an important prerequisite,because when the cost focus and control aspect is dominating,one must not only consider the different answers, i.e.,the numbers from the uncertainty analyses. One must alsoask whether they are answers <strong>to</strong> the same question.To present an aggregate view of the data, the differenceshave been calculated in percent and divided in<strong>to</strong> categoriesbased on the size of the difference.Table 3 shows that the recommendation from the externalconsultant is lower or equal <strong>to</strong> the projectsÕ proposal in8 out of 31 projects (26%). For the majority of the projects(74%), the external consultants recommend higher budgetlimits, in some cases up <strong>to</strong> 15% or more. On average the
- Page 1 and 2:
3PrefaceThe research presented in t
- Page 3 and 4:
5Table of contentsPART 1 ..........
- Page 5 and 6:
7Summary/abstractThe work reported
- Page 8 and 9:
101 IntroductionProjects are increa
- Page 10:
collection and interpretation of th
- Page 13 and 14: 15normative agendas, in other words
- Page 15 and 16: 17world of projects. The choice of
- Page 17 and 18: 19Figure 3 Sources and dataThe proj
- Page 19 and 20: 21In line with Flyvbjerg (2006b), t
- Page 21 and 22: 233 Concepts and constructs of thep
- Page 23 and 24: 25by most BOKs and textbooks in pro
- Page 25 and 26: 274 Main topics covered by the rese
- Page 27 and 28: 294.2 Empirical indications from ex
- Page 29 and 30: 31Budget proposed by the Norwegian
- Page 31 and 32: 3330 %Difference (%) from the propo
- Page 33 and 34: 3520 00018 000Cost development from
- Page 35 and 36: 37In paper 9 (Magnussen 2009a) an a
- Page 37 and 38: 395 Conclusions and directions for
- Page 39 and 40: 41estimates must be implemented at
- Page 41 and 42: 43Klakegg, Ole Jonny, Terry William
- Page 43 and 44: 45List of government documents 11Fi
- Page 45 and 46: 47Part 2 - Papers1. Magnussen, Ole
- Page 47 and 48: Paper 1Magnussen, Ole Morten, and K
- Page 49 and 50: AbstractCost overruns and delays ar
- Page 51 and 52: Cost effectiveness considerations:
- Page 53 and 54: demonstrates another fundamental is
- Page 55 and 56: Figure 1 The Extended Quality Assur
- Page 57 and 58: Expected effects of the revised qua
- Page 59 and 60: ReferencesBerg, Peder, Kilde, Halva
- Page 61 and 62: International Journal of Project Ma
- Page 63: O.M. Magnussen, N.O.E. Olsson / Int
- Page 67 and 68: O.M. Magnussen, N.O.E. Olsson / Int
- Page 69 and 70: Paper 3Magnussen, Ole M., and Nils
- Page 71 and 72: MANAGING THE FRONT-END OF PROJECTS:
- Page 73 and 74: Olsson, Samset, Austeng and Lädre
- Page 75 and 76: 1995; Packendorff, 1995), mainly cr
- Page 77 and 78: to a better way of managing the fro
- Page 79 and 80: Figure 1 Basic structure of the ind
- Page 81 and 82: from empirical investigations has b
- Page 83 and 84: among organizations, not individual
- Page 85 and 86: actors, the relationships are repro
- Page 87 and 88: the network approach has been used
- Page 89 and 90: established based on the views of i
- Page 91 and 92: IHFJKGAELDMBCA - The focal projectB
- Page 93 and 94: the NDEA. The communication strateg
- Page 95 and 96: Directorate for Cultural Heritage (
- Page 97 and 98: the project. The basic activity was
- Page 99 and 100: assumed to be more important than o
- Page 101 and 102: Another interesting observation was
- Page 103 and 104: REFERENCESEngwall, Mats. 2003. No p
- Page 105 and 106: Söderlund, Jonas. 2002. On the dev
- Page 107 and 108: Flexibility at Different Stages in
- Page 109 and 110: Reproduced with permission of the c
- Page 111 and 112: Reproduced with permission of the c
- Page 113 and 114: Reproduced with permission of the c
- Page 115:
Paper 5Olsson, Nils O. E., and Ole
- Page 126 and 127:
PAPERSGovernance Frameworks for Pub
- Page 128 and 129:
supporting setting of and achieving
- Page 130 and 131:
The study proceeded as follows:•
- Page 132 and 133:
y the Chief of Defence Materiel, he
- Page 134 and 135:
(within MoD but independent of thep
- Page 136 and 137:
Norway U.K. (MoD) U.K. (OGC)Charact
- Page 138 and 139:
from the external consultants was s
- Page 140 and 141:
governance. International StudiesRe
- Page 142 and 143:
Paper 7Williams, Terry, Ole Jonny K
- Page 144 and 145:
The development of the frameworksUK
- Page 146 and 147:
notable characteristic of the Norwe
- Page 148 and 149:
Office to the National Audit Office
- Page 150 and 151:
highly complex and changing decisio
- Page 152 and 153:
ARTICLE IN PRESSAvailable online at
- Page 154 and 155:
ARTICLE IN PRESST. Williams et al.
- Page 156 and 157:
ARTICLE IN PRESST. Williams et al.
- Page 158 and 159:
ARTICLE IN PRESST. Williams et al.
- Page 160 and 161:
ARTICLE IN PRESST. Williams et al.
- Page 162 and 163:
ARTICLE IN PRESST. Williams et al.
- Page 164 and 165:
Paper submitted to the Internationa
- Page 166 and 167:
One constraint is that actual costs
- Page 168 and 169:
In other words, the QA scheme is a
- Page 170 and 171:
author, there apparently are no stu
- Page 172 and 173:
20,0 %15,0 %10,0 %5,0 %0,0 %P50 est
- Page 174 and 175:
The pre-eminent result is that the
- Page 176 and 177:
Results from the analysis of the de
- Page 178 and 179:
more fundamental assessments of pro
- Page 180 and 181:
Paper 10Magnussen, Ole M. 2009. Exp
- Page 182 and 183:
Explaining cost estimate difference
- Page 184 and 185:
changes and external factors. Facto
- Page 186 and 187:
30 %Difference (%) from the propose
- Page 188 and 189:
Table 2 Areas associated with expla
- Page 190 and 191:
agency. In this case, the observed
- Page 192 and 193:
ReferencesFlyvbjerg, B., Holm, M.K.