- Page 2 and 3: Measuring physical fitnessin person
- Page 4: Rijksuniversiteit GroningenMeasurin
- Page 10 and 11: Chapter 1IntroductionChapter 1 | 9
- Page 12 and 13: overweight [15]. This prevalence is
- Page 14 and 15: Theoretical framework of the studyI
- Page 16 and 17: Components of physical fitnessThe a
- Page 18 and 19: Therefore, a study is put forward w
- Page 20 and 21: 2002;40:436-444.19 Temple VA, Frey
- Page 22 and 23: Chapter 2Feasibility and reliabilit
- Page 24 and 25: IntroductionPhysical fitness and he
- Page 26 and 27: GMFCS was presented to the investig
- Page 28 and 29: Body weightTo determine the body we
- Page 30 and 31: Table 1 Results of Wilcoxon rank te
- Page 32 and 33: Calculation of heightThe mean (SD)
- Page 34 and 35: DiscussionThe results of our study
- Page 36 and 37: References1 Bouchard C, Shepard RJ,
- Page 38 and 39: 37 Rimmer J, Kelly LE, Rosentswieg
- Page 40 and 41: Chapter 3Measuring waist circumfere
- Page 42 and 43: IntroductionChildren and adults wit
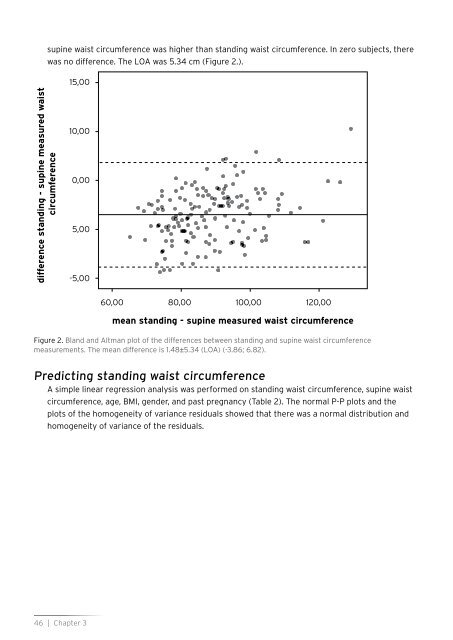
- Page 44 and 45: participants. These calculations as
- Page 48: Table 2. Simple regression analysis
- Page 54 and 55: Chapter 4Feasibility and reliabilit
- Page 56 and 57: IntroductionPeople with intellectua
- Page 58 and 59: Eighty representatives gave permiss
- Page 60 and 61: 3) The measurement procedure: The m
- Page 62 and 63: and whether motivation influenced t
- Page 64 and 65: Table 3. Mean peak heart rate achie
- Page 66 and 67: AcknowledgementsThis research was f
- Page 68 and 69: 21 Hopkins WG, Gaeta H, Thomas AC,
- Page 70 and 71: Chapter 5Psychometric quality of a
- Page 72 and 73: IntroductionIntellectual disability
- Page 74 and 75: Exclusion criteria were mental or p
- Page 76 and 77: participant had fulfilled the task.
- Page 78 and 79: Table 2. Descriptive results peak h
- Page 80 and 81: Table 3. Test-retest reliability of
- Page 82 and 83: Table 4. Correlation scored motivat
- Page 84 and 85: preceding GXT results on HR peak. G
- Page 86 and 87: References1 Schalock R, Brown I, Br
- Page 88 and 89: 37 Stanish HI, Temple VA, Frey GC.
- Page 90 and 91: Chapter 6Feasibility and reliabilit
- Page 92 and 93: IntroductionLocomotor skills in peo
- Page 94 and 95: this study was to evaluate the feas
- Page 96 and 97:
obtained from the legal representat
- Page 98 and 99:
Modified Berg Balance Scale scoresI
- Page 100 and 101:
Modified Berg Balance Scale scoresT
- Page 102 and 103:
References1 Van Erkelens-Zwets JHJ
- Page 104 and 105:
39 Dorai-Raj S. Binomial Confidence
- Page 106 and 107:
Chapter 7Feasibility, test-retest r
- Page 108 and 109:
IntroductionPersons with profound i
- Page 110 and 111:
DesignThe muscle tone and spasticit
- Page 112 and 113:
Interrater reliabilityFirstly, to d
- Page 114 and 115:
Table 3. Summary of the statistical
- Page 116 and 117:
Table 6. Summary of the statistical
- Page 118 and 119:
RecommendationsThe feasibility of c
- Page 120 and 121:
18 Gielen EJJM. Is spasticiteit te
- Page 122 and 123:
Chapter 8Heart Rate Pattern as an I
- Page 124 and 125:
IntroductionIt is important to gain
- Page 126 and 127:
48 persons18 persons lacked permiss
- Page 128 and 129:
Furthermore, the mean and the range
- Page 130 and 131:
Table 3. Day-to-day outline of the
- Page 132 and 133:
Relation between heart rate pattern
- Page 134 and 135:
patterns in this study we can concl
- Page 136 and 137:
References1 Emerson E. Underweight,
- Page 138 and 139:
38 Multilevel Models Project (2004)
- Page 140 and 141:
Chapter 9General DiscussionChapter
- Page 142 and 143:
on this. To sum up, testing in pers
- Page 144 and 145:
for future research it is recommend
- Page 146 and 147:
studies. Randomized Controlled Tria
- Page 148 and 149:
of these individuals require more?
- Page 150 and 151:
19 Lahtinen U, Rintala P, Malin A.
- Page 152 and 153:
SummarySummary | 151
- Page 154 and 155:
problems in both locomotor skills a
- Page 156 and 157:
subjects are to be applied to perso
- Page 158 and 159:
may be an indicator of activity lev
- Page 160 and 161:
SamenvattingSamenvatting | 159
- Page 162 and 163:
InleidingVoldoende bewegen en fithe
- Page 164 and 165:
verstandelijk niveau en bepaalde mo
- Page 166 and 167:
Hieruit bleek, dat de motivatie van
- Page 168 and 169:
Verder is duidelijk geworden dat me
- Page 170 and 171:
DankwoordDankwoord | 169
- Page 172 and 173:
De leden van de leescommissie, prof
- Page 174 and 175:
Judith van der Boom, dank je wel vo
- Page 176 and 177:
Dankwoord | 175
- Page 178 and 179:
Curriculum vitaeCurriculum vitae |
- Page 180:
Curriculum vitae | 179