

World Bank Document
World Bank Document
World Bank Document
- No tags were found...

You also want an ePaper? Increase the reach of your titles
YUMPU automatically turns print PDFs into web optimized ePapers that Google loves.
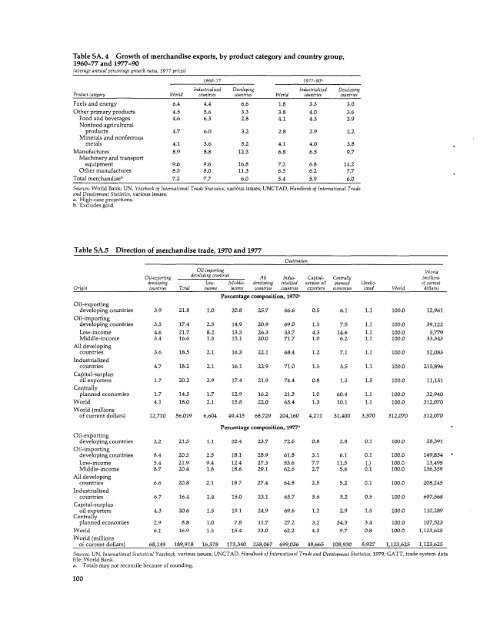
Table SA. 4 Growth of merchandise exports, by product category and country group,1960-77 and 1977-90(average annual percentage growth rates, 1977 prices)1960-77 1977-90'Industrialized Developing Industrialized DevelopingProduct category <strong>World</strong> countries countries <strong>World</strong> countries countriesFuels and energy 6.4 4.4 6.6 1.8 3.3 3.0Other primary products 4.5 5.6 3.3 3.8 4.0 3.6Food and beverages 4.6 6.3 2.8 4.1 4.3 3.9Nonfood agriculturalproducts 4.7 6.0 3.2 2.8 2.9 2.2Minerals and nonferrousmetals 4.1 3.6 5.2 4.1 4.0 3.8Manufactures 8.9 8.8 12.3 6.8 6.5 9.7Machinery and transportequipment 9.6 9.6 16.8 7.2 6.8 14.2Other manufactures 8.3 8.0 11.3 6.5 6.2 7.7Total merchandiseb 7.2 7.7 6.0 5.4 5.9 6.0Sources: <strong>World</strong> <strong>Bank</strong>; UN, Yearbook of International Trade Statistics, various issues; UNCTAD, Handbook of International Tradeand Development Statistics, various issues.a. High-case projections.b. Excludes gold.Table SA.5 Direction of merchandise trade, 1970 and 1977DestinationOil-importing<strong>World</strong>Oil-exporting developing countries All Indus- Capital- Centrally (millionsdeveloping Low- Middle- developing Irialized surplus oil planned Unallo- of currentOrigin countries Total income income countries countries exporters economies cated <strong>World</strong> dollars)Percentage composition, 1970'Oil-exportingdeveloping countries 3.9 21.8 1.0 20.8 25.7 66.6 0.5 6.1 1.1 100.0 12,961Oil-importingdeveloping countries 3.5 17.4 2.5 14.9 20.9 69.0 1.5 7.5 1.1 100.0 39,122Low-income 4.6 21.7 8.2 13.5 26.3 53.7 4.3 14.6 1.1 100.0 5,779Middle-income 3.4 16.6 1.5 15.1 20.0 71.7 1.0 6.2 1.1 100.0 33,343All developingcountries 3.6 18.5 2.1 16.3 22.1 68.4 1.2 7.1 1.1 100.0 52,083Industrializedcountries 4.7 18.2 2.1 16.1 22.9 71.0 1.5 3.5 1.1 100.0 215,896Capital-surplusoil exporters 1.7 20.2 2.9 17.4 21.9 74.4 0.8 1.5 1.5 100.0 11,151Centrallyplanned economies 1.7 14.5 1.7 12.9 16.2 21.3 1.0 60.4 1.1 100.0 32,940<strong>World</strong> 4.1 18.0 2.1 15.8 22.0 65.4 1.3 10.1 1.1 100.0 312,070<strong>World</strong> (millionsof current dollars) 12,710 56,019 6,604 49,415 68,729 204,160 4,211 31,400 3,570 312,070 312,070Percentage composition, 1977aOil-exportingdeveloping countries 2.2 21.5 1.1 20.4 23.7 72.6 0.8 2.8 0.1 100.0 58,391Oil-importingdeveloping countries 8.4 20.5 2.5 18.1 28.9 61.8 3.1 6.1 0.1 100.0 149,854Low-income 5.4 21.9 9.4 12.4 27.3 53.6 7.7 11.5 (.) 100.0 13,495Middle-income 8.7 20.4 1.8 18.6 29.1 62.6 2.7 5.6 0.1 100.0 136,359All developingcountries 6.6 20.8 2.1 18.7 27.4 64.8 2.5 5.2 0.1 100.0 208,245Industrializedcountries 6.7 16.4 1.4 15.0 23.1 65.7 5.6 5.2 0.5 100.0 697,568Capital-surplusoil exporters 4.3 20.6 1.5 19.1 24.9 69.6 1.2 2.9 1.5 100.0 110,289Centrallyplanned economies 2.9 8.8 1.0 7.8 11.7 27.2 3.2 54.5 3.4 100.0 107,523<strong>World</strong> 6.1 16.9 1.5 15.4 23.0 62.2 4.3 9.7 0.8 100.0 1,123,625<strong>World</strong> (millionsof current dollars) 68,149 189,918 16,578 173,340 258,067 699,036 48,665 108,930 8,927 1,123,625 1,123,625Sources: UN, International Statistical Yearbook, various issues; UNCTAD, Handbook of International Trade and Development Statistics, 1979; GATT, trade system datafile; <strong>World</strong> <strong>Bank</strong>.a. Totals may not reconcile because of rounding.100


