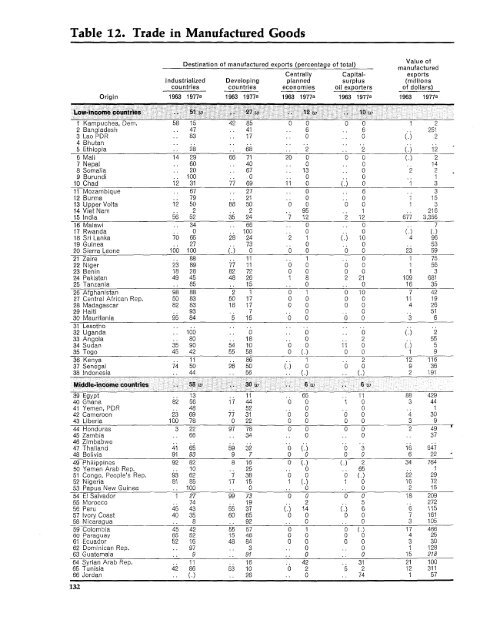
Table :12. Trade in Manufactured GoodsDestination of manufactured exports (percentage of total)Value ofmanufacturedCentrally Capital- exportsIndustrialized Developing planned surplus (millionscountries countries economies oil exporters of dollars)Origin 1963 1977a 1963 1977a 1963 1 977a 1963 1977a 1963 1977a1 Kampuchea. Dem. 58 15 42 85 0 0 0 0 1 22 Bangladesh .. 47 . 41 .. 6 .. 6 . 2513 Lao PDR .. 83 .. 17 .. 0 .. 0 .) 24 Bhutan5 Ethlopi'a .. 28 .. 68 .. 2 .. 2 .) 126 Mali 14 29 66 71 20 0 0 0 () 27 Nepal .. 60 .. 40 .. 0 .. 0 148 Somalia .. 20 .. 67 .. 13 .. 0 2 29 Burundi .. 10 . 0 .. 0 . 0 .. 110 Chad 12 31 77 69 11 0 () 0 1 311 Mozambique .. 67 . 27 .. 0 . 6 .. 312 Burma .. 79 .. 21 .. 0 .. 0 1 1513 Upper Volta 12 50 88 50 0 0 0 0 1 314 Viet Nam . . 2 . . 2 .. 95 .. 1 .. 21615 India 56 52 35 24 7 12 2 12 677 3,35616 Malawi .. 34 .. 66 .. 0 . 0 *717 Rwanda .. 0 IOD0 . 0 .. 0 (. H.18 SriLanka 70 65 28 24 2 1 () 10 4 9619 Guinea . . 27 .. 73 .. 0 . 0 .. 5320 Sierra Leone 100 100 () 0 0 0 0 0 23 5921 Zaire . . 88 .. 11 .. 1 .. 0 1 7522 Niger 23 89 77 11 0 0 0 0 1 5624 Pakistan23 Benin491845284882 72260108020211109368125 Tanzania . . 85 .. 15 .. 0 .. 0 16 3526 Afghanistan 98 88 2 1 0 1 0 10 7 4227 Central African Rep. 50 83 50 17 0 0 0 0 11 1928 Madagascar 82 83 18 17 0 0 0 0 4 2629 Haiti . . 93 .. 7 .. 0 .. 0 .. 5130 Mauritania 95 84 5 16 0 0 0 0 3 631 Lesotho32 Uganda .. 100 .. 0 . 0 .. 0 () 233 Angola .. 80 .. 18 -. 0 -. 2 .. 5534 Sudan 35 90 54 10 0 0 11 0 () 535 Togo 45 42 55 58 0 (.) 0 0 1 936 Kenya .. 11 . 86 ..37 Senegal 74 50 26 50 ()10.0201291163638 Indonesia .. 44 .. 56 . . C)2 191~Middl-noeconre. 518 t 3 w. 6 t . 6t39 Egypt40 Ghana..821356..171144.0650..1110388 4294441 Yemen, PDR .. 48 .. 52 .. 0 . 0 .. 142 Cameroon 23 69 77 31 0 0 0 0 4 3043 Liberia 100 78 0 22 0 0 0 0 3 944 Honduras 3 22 97 78 0 0 0 0 2 4945 Zambia .. 66 .. 34 .. 0 .. 0 . 3746 Zimbabwe47 Thailand 41 65 5 320 316 54748 Bolivia 91 93 9 7 0 0 0 0 6 2249 Philippines 92 82 8 16 0 H. . 2 34 76450oYemen Arab Rep. .. 10 .. 25 .. 0 . 65 .. 151 Congo, People's Rep. 93 62 7 38 0 052 Nigeria 81 85 17 16 1 (.)01(.)02215297253 Papua New Guinea .. 100) . 0 .. 0 .. 0 2 1554 El Salvador 1 27 99 73 0 0 0 0 18 20955 Morocco .. 74 .. 19 .. 2 .. 5 27256 Peru 45 43 55 37 () 14 () 6 6 11557 Ivory Coast 40 35 60 65 0 0 0 0 7 161S8 Nicaragua .. 8 . 92 .. 0 . 0 3 10559 Colombia 4560 Paraguay 55425255155746001000(-)01744662561lEcuador 52 16 48 84 0 0 0 0 3 3062 Dominican Rep. .. 97 .. 3 . 0 .. 0 1 12863 Guatemala .. 9 . 91 .. 0 . 0 15 21864 Syrian Arab Rep. .. 11 . 16 .. 42 .. 31 21 10065 Tunisia 42 86 53 10 0 2 5 2 12 31166 Jordan . ().. 26 .. 0 .. 74 1 57132
Destination of manufactured exports (percentage of total)manuefacueCentrally Capital- exportsIndustrialized Developing planned surplus (millionscountries countries economies oil exporters of dollars)Origin 1963 19778 1963 19778 1963 19778 1963 19778 1963 1977867 Mialaysia 64 35 (.) 1 63 1,12168 Jamaica 83 68 17 ~29 0 3 0 0 13 34569 Lebaron . . 19 35 .. 3 43 8 45270 Korea, Rep. of 57 74 43 14 0 (.) 0 12 39 8,48071 Turkey 73 74 14 9 13 5 .) 12 6 431'72 Algeria 76 . . 19 .. 3 2 3873 Mexico 69 61 31 39 H. . . 0 147 1,18274 Panama 5 10 95 90 0 0 0 0 .) 2375 Taiwan 30 52 13 5 129 7,925,76 Chile 38 57 62 43 () 0 (. C) 22 14577 South Airica -. 67 29 .. 0 4 318 2,57678 Costa Ri:a .. 12 88 .. (.) .. 0 5 20379 Brazil 59 53 40 43 1 2 .) 2 45 3,1418o Uruguay .. 56 . . 41 .. 3 ()31 23681 Argentina 52 31 46 63 2 6 () .)79 1,34982 Portugal 53 79 46 16 (.) 4 1 1 246 1,42083 Yugoslavia 37 29 29 17 33 45 1 9 468 3,41584 Trinidad and Tobago 40 86 60 14 0 (.) 0 C.) 10 10585 Venezuela 79 52 21 48 (.) 0 (.) 0 43 15386 IHong Kong 71 83 28 14 0 (.) 1 3 617 7,26787 Greece 60 58 34 18 2 6 4 18 27 1,37388 Singapo'o 5 54 95 43 (.) (.) (.) 3 352 3,62689 Spain 62 60 35 32 2 3 1 5 227 7,21490 Israel 72 75 26 21 2 1 0 3 203 2,453Indtustrialized countries 65 w 65 w 31 w 25 w 3 w 4 w 1 w 6 w91 Ireland 94 92 6 6 C.) 1 (.) 1 133 2,42092 Italy 64 64 29 21 5 6 2 9 3,842 37,63093 New Zeatland . . 85 . . 14 (.) 1 40 52094 United Kingdom 57 65 39 25 3 3 1 7 9,412 46,88495 Finland 59 63 13 8 28 27 (.) 2 634 5,68696 Austria 66 66 17 15 17 16 0 3 985 8,24197 Japan98 Australia445947685040402851411(.)934,812 77,514332 2,80899 France 58 63 39 28 2 5 1 4 5,744 48,585100 Netherla.nds 79 79 18 15 2 3 1 3 2,693 23,123101 Belgium 85 83 13 12 1 2 1 3 3,572 28,991102 Canada 87 91 13 8 (.) (.) (.) 1 2,165 21,046103 Norway 78 69 19 26 3 4 (.) 1 529 4,654104 Germany, Fed. Rep. 75 69 22 19 2 6 1 6 12,812 104,361105 United States 56 58 42 33 .) 1 2 8 12,453 82,521106 Denmars 73 78 19 15 8 4 0 3 752 5,580107 Sweden 78 76 19 15 3 5 C.) 4 2,143 15,284108 Switzerland 72 66 25 23 2 6 1 5 2,163 15,821Capital-surpluscul exporters .. 31w . 24 w . 3 w 42 w109 Iraq () 9 21 79 () 0 79 12 5 18110 Iran 64 39 28 13 1 31 7 17 33 158111 Libya 33 22 .22 45 .. 0 .1112Saudi Arabia 22 .. 70 .. 1 .. 7 0 121113 Kuwait .. 31 . 19 .. (). 50 .. 1,059Centrally plannedeconomies . 14 w 1. Iw 64 w . 4 w114 China .. 31 .. 50 . 14 . 5 .. 3,684115 Korea, Dem. Rep, .. 5 13 .. 73 .. 9 . 197116 Albania .. 35 .. 37 . 28 .. 0 . 42117 Cuba .. 72 .. 4 . 24 .. 0 . 10118 Mongol ia .. 2 .. 0 . 98 . 0 .. 32119 Romania . 265. 17 .. 52 .. 5. 4,763120 Bulgaria . 6 . 11 81.. 2. 4,025121 Hungary 20 .. 14 .. 62 .. 4 .. 3,939122 Poland 19 .. 9 . 70 .. 2 . 8,351123 USSR .. 10 . 25 .. 59 .. 6 . 21,020124 Czechoslovakia .. 14 I 11 73 .. 2 .. 9,045125 German Dem. Rep. .. 10 . 10 .. 79 . 1 .. 10,242a. Figures in talics are for 1976, not 1977.'133
- Page 1:
t' 8 ~~~~ottoWorld Development Repo
- Page 4 and 5:
Oc 1980 by the International Bankfo
- Page 6 and 7:
ivThis report was prepared by a tea
- Page 8 and 9:
Text tables2.1 Summary of prospects
- Page 10 and 11:
DefinitionsCountry groups in the an
- Page 12 and 13:
illion people have barely enough fa
- Page 14:
in official aid and other capital a
- Page 17 and 18:
production and consumption; in- Tab
- Page 19 and 20:
measures can raise efficiency fairl
- Page 21 and 22:
adjustment; but the increases pro-
- Page 23 and 24:
dustrialized countries' GNP would T
- Page 25 and 26:
windfalls, some of their extra cont
- Page 27 and 28:
e done to increase the supplies Lat
- Page 29 and 30:
exchange-rate depreciation, by perc
- Page 31 and 32:
Table 3.2 World merchandise trade,
- Page 33 and 34:
* Inward-looking policies may exper
- Page 35 and 36:
inward-looking policies, with high
- Page 37 and 38:
cause individual banks or bank- Tab
- Page 39 and 40:
to GNP, of all large industrial na-
- Page 41 and 42:
in Chapter 2). Ways of increasing a
- Page 43 and 44:
4 Poverty, growth and human develop
- Page 45 and 46:
expectancy was less than 50 years,
- Page 47 and 48:
population density (see page 39). e
- Page 49 and 50:
ably could not have been achieved c
- Page 51 and 52:
ution of income typically is less T
- Page 53 and 54:
Table 4.2 Irrigation and income, se
- Page 55 and 56:
ment strategies that assume that in
- Page 57 and 58:
average 40 percent drop out before
- Page 59 and 60:
this may be offset by shifts in the
- Page 61 and 62:
UNESCO concluded that the poorUnemp
- Page 63 and 64:
A typical finding showed the mean o
- Page 65 and 66:
Table5.6 Differences in life tend t
- Page 67 and 68:
are more expensive and less critica
- Page 69 and 70:
per hos pital and clinic, and to st
- Page 71 and 72:
peaks in farm work and widespreadin
- Page 73 and 74:
confined to particular places. In A
- Page 75 and 76:
Indonesia, Colombia and Chilehave r
- Page 77 and 78:
(which respond only gradually to cu
- Page 79 and 80:
Contraceptive technologyresearch in
- Page 81 and 82:
6 Implementing human development pr
- Page 83 and 84:
probably China-have managed Table 6
- Page 85 and 86:
percent of the development bud- dev
- Page 87 and 88:
members, too, as no bureaucraticRur
- Page 89 and 90:
Private costs of using public servi
- Page 91 and 92: ut not teachers or health workers,
- Page 93 and 94: 7 Priorities and progress in region
- Page 95 and 96: literacy and life expectancy); andF
- Page 97 and 98: to establish the necessary admin-Fi
- Page 99 and 100: Poverty Figure 7.5 South Asia: life
- Page 101 and 102: and North Africa cover the spec- gr
- Page 103 and 104: The high level of urbanization well
- Page 105 and 106: Chaipter 8 Summary and conclusionsI
- Page 107 and 108: is high, frequently well above that
- Page 109 and 110: Stat.istical appendix to Part ITabl
- Page 111 and 112: Table SA.6 Capital flows and debt o
- Page 113 and 114: Montgomery survey administra- publi
- Page 115 and 116: AnnexWorldDevelopmentIndicators
- Page 117 and 118: Table 13. Balance of Payments and D
- Page 119 and 120: IntroductionThe World Development I
- Page 121 and 122: GNP per capitaAverage indexAverageo
- Page 123 and 124: Average annual growth rate (percent
- Page 125 and 126: Distribution of gross domestic prod
- Page 127 and 128: Average annual growth rate (percent
- Page 129 and 130: Distribution of gross domestic prod
- Page 131 and 132: Distribution of value added (percen
- Page 133 and 134: EnergyEnergyconsumptionAverage annu
- Page 135 and 136: Merchandise tradeAverage annual gro
- Page 137 and 138: Percentage share of merchandise exp
- Page 139 and 140: Percentage share of merchandise imp
- Page 141: Destination of merchandise exports
- Page 145 and 146: Current accountbalance before Inter
- Page 147 and 148: Public and publicly guaranteed medi
- Page 149 and 150: External public debtoutstanding and
- Page 151 and 152: Amount1981a 1982a 1983a 1984a 1985a
- Page 153 and 154: Average annualHypotheticalgrowth of
- Page 155 and 156: PercentageCrude Crude Percentage Pe
- Page 157 and 158: Percentage ofpopulation ofworking a
- Page 159 and 160: Percentage of urban population Numb
- Page 161 and 162: Life Infant Childexpectancy mortali
- Page 163 and 164: PercentageDaily calorie supplyPopul
- Page 165 and 166: Number Numberenrolled in enrolled i
- Page 167 and 168: Percentage share of household incom
- Page 169 and 170: Average index Tables 4 and 5. Growt
- Page 171 and 172: 28 (minerals, crude fertilizers and
- Page 173 and 174: continues to grow after replacement
- Page 175 and 176: posttax income and conceptually tic
- Page 180: -~~~ S-~~~~~ sEuropean Office:66, a