World Bank Document
World Bank Document
World Bank Document
- No tags were found...
Create successful ePaper yourself
Turn your PDF publications into a flip-book with our unique Google optimized e-Paper software.
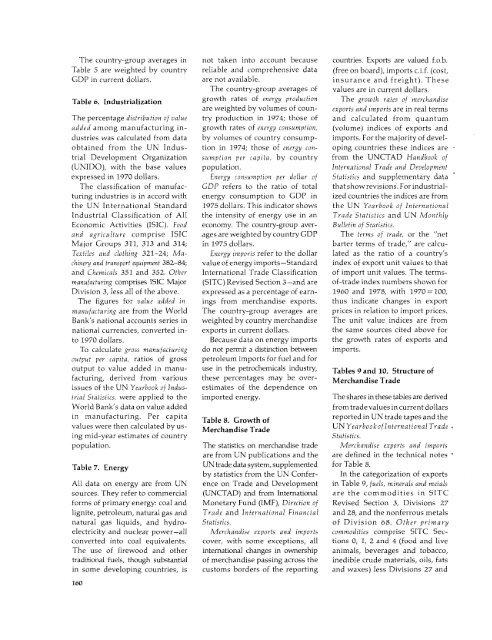
The country-group averages in not taken into account because countries. Exports are valued f.o.b.Table 5 are weighted by country reliable and comprehensive data (free on board), imports c.i.f. (cost,GDP in current dollars. are not available. insurance and freight). TheseThe country-group averages of values are in current dollars.Table 6. Industrialization growth rates of energy production The growth rates of merchandiseare weighted by volumes of coun- exports and imports are in real termsThe percentage distribution of value try production in 1974; those of and calculated from quantumadded among manufacturing in- growth rates of energy consumption, (volume) indices of exports anddustries was calculated from data by volumes of country consump- imports. For the majority of develobtainedfrom the UN Indus- tion in 1974; those of energy con- oping countries these indices aretrial Development Organization sumption per capita, by country from the UNCTAD Handbook of(UNIDO), with the base values population. International Trade and Developmentexpressed in 1970 dollars. Energy consumption per dollar of Statistics and supplementary dataThe classification of manufac- GDP refers to the ratio of total thatshow revisions. For industrialturingindustries is in accord with energy consumption to GDP in ized countries the indices are fromthe UN International Standard 1975 dollars. This indicator shows the UN Yearbook of InternationalIndustrial Classification of All the intensity of energy use in an Trade Statistics and UN MonthlyEconomic Activities (ISIC). Food economy. The country-group aver- Bulletin of Statistics.and agriculture comprise ISIC agesare weighted bycountryGDP The terms of trade, or the "netMajor Groups 311, 313 and 314; in 1975 dollars. barter terms of trade," are calcu-Textiles and clothing 321-24; Ma- Energy imports refer to the dollar lated as the ratio of a country'schinery and transport equipment 382-84; value of energy imports-Standard index of export unit values to thatand Chemicals 351 and 352. Other International Trade Classification of import unit values. The termsmanufacturingcomprises ISIC Major (SITC) Revised Section 3-and are of-trade index numbers shown forDivision 3, less all of the above. expressed as a percentage of earn- 1960 and 1978, with 1970 = 100,The figures for value added in ings from merchandise exports. thus indicate changes in exportmanufacturing are from the <strong>World</strong> The country-group averages are prices in relation to import prices.<strong>Bank</strong>'s national accounts series in weighted by country merchandise The unit value indices are fromnational currencies, converted in- exports in current dollars. the same sources cited above forto 1970 dollars. Because data on energy imports the growth rates of exports andTo calculate gross manufacturing do not permit a distinction between imports.output per capita, ratios of gross petroleum imports for fuel and foroutput to value added in manu- use in the petrochemicals industry, Tables 9 and 10. Structure offacturing, derived from various these percentages may be over- Merchandise TradeissueS of the UN Yearbook of Indus- estimates of the dependence ontrial Statistics, were applied to the imported energy. The shares in these tables are derived<strong>World</strong> <strong>Bank</strong>'s data on value addedfrom trade values in current dollarsin manufacturing. Per capita Table 8. Growth of reported in UN trade tapes and thevalues were then calculated by us- Merchandise Trade UN Yearbookoflnternational Tradeing mid-year estimates of countryStatistics.population. The statistics on merchandise trade Merchandise exports and importsare from UN publications and the are defined in the technical notesTable 7. Energy UN trade data system, supplementedby statistics from the UN ConferforTable 8.In the categorization of exportsAll data on energy are from UN ence on Trade and Development in Table 9, fuels, minerals and metalssources. They refer to commercial (UNCTAD) and from Intemational are the commodities in SITCforms of primary energy: coal and Monetary Fund (IMF), Direction of Revised Section 3, Divisions 27lignite, petroleum, natural gas and Trade and International Financial and 28, and the nonferrous metalsnatural gas liquids, and hydro- Statistics. of Division 68. Other primaryelectricity and nuclear power-all Merchandise exports and imports commodities comprise SITC Secconvertedinto coal equivalents. cover, with some exceptions, all tions 0, 1, 2 and 4 (food and liveThe use of firewood and other intemational changes in ownership animals, beverages and tobacco,traditional fuels, though substantial of merchandise passing across the inedible crude materials, oils, fatsin some developing countries, is customs borders of the reporting and waxes) less Divisions 27 and160


