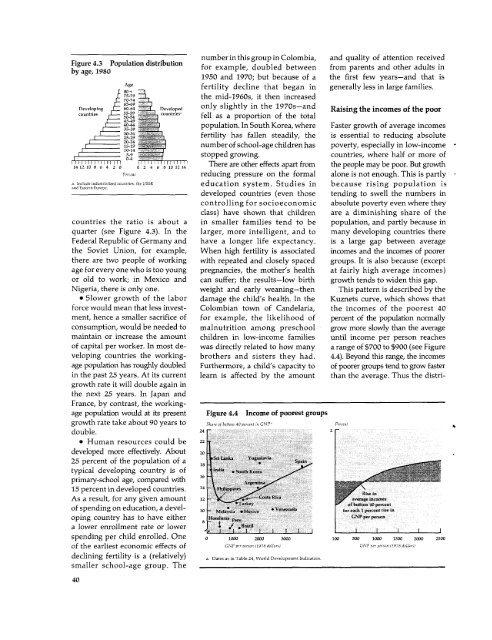
number in this group in Colombia, and quality of attention receivedby age, 1980 for example, doubled between from parents and other adults in1950 and 1970; but because of a the first few years-and that isAge fertility decline that began in generally less in large families.[t 75-79 X the mid-1960s, it then increasedDeveloping 65-69 only slgtyin the 1970s-andthDevelopig_60-64 i_ Developed slightly ith19 s-andcountries countrieSl fell as a proportion of the totalf hRaising the incomes of the poor45-4940-44 < population. In South Korea, where Faster growth of average incomesl 3l02O-34 ii.., fertility has fallen steadily, the is essential to reducing absoluteI20-2415-19 number of school-age children has poverty, especially in low-income~~~~~~10-14-r-a ^5I9 stopped growing. countries, where half or more of141210 1 64 2 0 0 2 6 I 84101214 There are other effects apart from the people may be poor. But growthPersCet reducing pressure on the formal alone is not enough. This is partlya. Includeindustrialid countries, the USSR education system. Studies in because rising population isand Eastern Europe.developed countries (even those tending to swell the numbers incontrolling for socioeconomic absolute poverty even where theyclass) have shown that children are a diminishing share of thecountries the ratio is about a in smaller families tend to be population, and partly because inquarter (see Figure 4.3). In the larger, more intelligent, and to many developing countries thereFederal Republic of Germany and have a longer life expectancy. is a large gap between averagethe Soviet Union, for example, When high fertility is associated incomes and the incomes of poorerthere are two people of working with repeated and closely spaced groups. It is also because (exceptage for every one who is too young pregnancies, the mother's health at fairly high average incomes)or old to work; in Mexico and can suffer; the results-low birth growth tends to widen this gap.Nigeria, there is only one. weight and early weaning-then This pattern is described by the* Slower growth of the labor damage the child's health. In the Kuznets curve, which shows thatforce would mean that less invest- Colombian town of Candelaria, the incomes of the poorest 40ment, hence a smaller sacrifice of for example, the likelihood of percent of the population normallyconsumption, would be needed to malnutrition among preschool grow more slowly than the averagemaintain or increase the amount children in low-income families until income per person reachesof capital per worker. In most de- was directly related to how many a range of $700 to $900 (see Figureveloping countries the working- brothers and sisters they had. 4.4). Beyond this range, the incomesage population has roughly doubled Furthermore, a child's capacity to of poorer groups tend to grow fasterin the past 25 years. At its current learn is affected by the amount than the average. Thus the distrigrowthrate it will double again inthe next 25 years. In Japan andFrance, by contrast, the workingagepopulation would at its present Figure 4.4 Income of poorest groupsgrowth rate take about 90 years to Share of bott-o 40 per-en t is GNP Percenidouble. 24 2* Human resources could be 22developed more effectively. About 2025 percent of the population of a 18 ~ ~ ~ pitypical developing country is of laprimary-school age, compared with 1615 percent in developed countries. 14 Ttili p wAs a result, for any given amount 12 *.acsaRaaeaeicneof spending on education, a devel- 10 = int ise inoping country has to have either s n sa lower enrollment rate or lower 8 jS / caziIspending per child enrolled. One o 1000 2000 3000 100 500 1000 1500 2000 2500of the earliest economic effects of GNPper pers.. (978 dolars,) GNP per pe-ro (1978 doll-rs)declining fertility is a (relatively) a. Dates as-i Table 24, <strong>World</strong>Developent Indicators.smaller school-age group. The40
ution of income typically is less The rest of this section looks replace existing tenants, or ifunequal in developed countries more closely at the range of things landlords (in their alternate rolesthan in developing countries. that can be done-in the context as moneylenders and employers)The initial rise in inequality of strategies aimed at increasing have been able to compensate foroccurs chiefly because the impulses average incomes-to raise the loss of rent by extracting moreand opportunities for harnessing incomes of those in absolute poverty. favorable terms from their tenantsmoder:n technology in a backwardin other transactions.economy are unevenly spread. Land and land tenure Despite the difficulties, land andThose who perceive (and can take Land reform - the redistribution tenure reform (in urban as well asadvantage of) these opportunities of land ownership in favor of the rural areas) remains a vital eleforgeahead of those who stay in poor-has been tried in many ment of poverty reduction intraditional lines of activity-who countries, with mixed results. In many countries, and it meritsin sorme cases may be undercut some (South Korea, for example) it strong support.and irnpoverished. As develop- has raised the incomes of the ruralment proceeds, though, the modem poor considerably-though better Capital and creditsectors in industry, commerce and access to credit and extension The poor conspicuously lackagriculture become increasingly services for small farmers has every kind of physical capital, butdominant, drawing most of the proved an essential adjunct. In their poverty limits their demonlaborout of the traditional sectors most developing countries there strated ability to respond to goodand pulling up the earnings of those is scope for further land reform. investment opportunities (suchwho remain in them. Because small farms tend to as new seed varieties) by savingThe Kuznets curve is not an iron apply more labor per hectare and more. The alternative is to borrow,law. As Figure 4.4 shows, some to use land and capital at least as which can enable the poor not onlycountries lie well above it, others productively as large farms, land to buy pumps and fertilizers forbelow. (Information on changes reform will usually increase theirfarms, and tools and materialsin income inequality in particular agricultural output after a period for their workshops, but also todeveloping countries confirms that of adjustment (see box overleaf). get their children educated, to paythey do not all follow a path of the But it faces social and political for transport to better jobs in urbansame shape.) Much depends on opposition-from landlords and areas, and to tide themselves over pegovernmentpolicy, which can re- from urban groups that benefit riods of illness and unemployment.duce the unevenness of the mod- from the bigger marketed sur- But government efforts to helpernization process-and accelerate pluses of large farms. the poor by supplementing tradigrowtlh-bypromoting productiv- As an altemative to distributing tional informal sources of creditity gains in traditional small-scale individual parcels of land-which have had only limited success. Foragriculture, increasing the rate at is easier where resettlement on long-term credit especially, lenderswhich labor is absorbed into the uncultivated land is possible, as in want collateral-so those with fewmodern industrial sector, and not Brazil, Indonesia and Upper Volta assets, or who want to acquire inconcentratingpublic investment -some countries (Algeria, China tangible assets (such as education)and services on a few places and and Peru, for example) have estab- are at a substantial disadvantage.socialgroups. lished cooperatives and communes. In addition, governments andIn addition, governments can But these have tended to encounter, public agencies usually have nottake measures to reduce the in- in varying degree, serious prob- charged an interest rate high enoughequality of incomes by improving lems of incentives and management. to make credit programs self-supthedistribution of productive assets Other countries have revised land porting. And the limited amounts(land, capital, labor skills); avoiding tenure rules: greater security of of subsidized credit available haveprice and wage policies that bene- tenure gives tenant farmers more often been channeled away fromfit the urban middle classes at the incentive to invest. Schemes that the poor toward more influentialexpense of small farmers; discour- encourage landlords of share- groups.aging the exploitation of public croppers to share the cost of seeds For the poor to benefit fromposition for private gain; and mak- and fertilizers have also tended physical investment, however,ing taxes more progressive. They to increase efficiency. But rent con- they do not necessarily have tocan also take measures to improve trol has proved hard to enforce- own or control the assets themthelot of the dependent poor- especially if there have been plenty selves. Public investment (andchildren, the agedand manywomen. of landless laborers willing to private investment by people who41
- Page 1: t' 8 ~~~~ottoWorld Development Repo
- Page 4 and 5: Oc 1980 by the International Bankfo
- Page 6 and 7: ivThis report was prepared by a tea
- Page 8 and 9: Text tables2.1 Summary of prospects
- Page 10 and 11: DefinitionsCountry groups in the an
- Page 12 and 13: illion people have barely enough fa
- Page 14: in official aid and other capital a
- Page 17 and 18: production and consumption; in- Tab
- Page 19 and 20: measures can raise efficiency fairl
- Page 21 and 22: adjustment; but the increases pro-
- Page 23 and 24: dustrialized countries' GNP would T
- Page 25 and 26: windfalls, some of their extra cont
- Page 27 and 28: e done to increase the supplies Lat
- Page 29 and 30: exchange-rate depreciation, by perc
- Page 31 and 32: Table 3.2 World merchandise trade,
- Page 33 and 34: * Inward-looking policies may exper
- Page 35 and 36: inward-looking policies, with high
- Page 37 and 38: cause individual banks or bank- Tab
- Page 39 and 40: to GNP, of all large industrial na-
- Page 41 and 42: in Chapter 2). Ways of increasing a
- Page 43 and 44: 4 Poverty, growth and human develop
- Page 45 and 46: expectancy was less than 50 years,
- Page 47 and 48: population density (see page 39). e
- Page 49: ably could not have been achieved c
- Page 53 and 54: Table 4.2 Irrigation and income, se
- Page 55 and 56: ment strategies that assume that in
- Page 57 and 58: average 40 percent drop out before
- Page 59 and 60: this may be offset by shifts in the
- Page 61 and 62: UNESCO concluded that the poorUnemp
- Page 63 and 64: A typical finding showed the mean o
- Page 65 and 66: Table5.6 Differences in life tend t
- Page 67 and 68: are more expensive and less critica
- Page 69 and 70: per hos pital and clinic, and to st
- Page 71 and 72: peaks in farm work and widespreadin
- Page 73 and 74: confined to particular places. In A
- Page 75 and 76: Indonesia, Colombia and Chilehave r
- Page 77 and 78: (which respond only gradually to cu
- Page 79 and 80: Contraceptive technologyresearch in
- Page 81 and 82: 6 Implementing human development pr
- Page 83 and 84: probably China-have managed Table 6
- Page 85 and 86: percent of the development bud- dev
- Page 87 and 88: members, too, as no bureaucraticRur
- Page 89 and 90: Private costs of using public servi
- Page 91 and 92: ut not teachers or health workers,
- Page 93 and 94: 7 Priorities and progress in region
- Page 95 and 96: literacy and life expectancy); andF
- Page 97 and 98: to establish the necessary admin-Fi
- Page 99 and 100: Poverty Figure 7.5 South Asia: life
- Page 101 and 102:
and North Africa cover the spec- gr
- Page 103 and 104:
The high level of urbanization well
- Page 105 and 106:
Chaipter 8 Summary and conclusionsI
- Page 107 and 108:
is high, frequently well above that
- Page 109 and 110:
Stat.istical appendix to Part ITabl
- Page 111 and 112:
Table SA.6 Capital flows and debt o
- Page 113 and 114:
Montgomery survey administra- publi
- Page 115 and 116:
AnnexWorldDevelopmentIndicators
- Page 117 and 118:
Table 13. Balance of Payments and D
- Page 119 and 120:
IntroductionThe World Development I
- Page 121 and 122:
GNP per capitaAverage indexAverageo
- Page 123 and 124:
Average annual growth rate (percent
- Page 125 and 126:
Distribution of gross domestic prod
- Page 127 and 128:
Average annual growth rate (percent
- Page 129 and 130:
Distribution of gross domestic prod
- Page 131 and 132:
Distribution of value added (percen
- Page 133 and 134:
EnergyEnergyconsumptionAverage annu
- Page 135 and 136:
Merchandise tradeAverage annual gro
- Page 137 and 138:
Percentage share of merchandise exp
- Page 139 and 140:
Percentage share of merchandise imp
- Page 141 and 142:
Destination of merchandise exports
- Page 143 and 144:
Destination of manufactured exports
- Page 145 and 146:
Current accountbalance before Inter
- Page 147 and 148:
Public and publicly guaranteed medi
- Page 149 and 150:
External public debtoutstanding and
- Page 151 and 152:
Amount1981a 1982a 1983a 1984a 1985a
- Page 153 and 154:
Average annualHypotheticalgrowth of
- Page 155 and 156:
PercentageCrude Crude Percentage Pe
- Page 157 and 158:
Percentage ofpopulation ofworking a
- Page 159 and 160:
Percentage of urban population Numb
- Page 161 and 162:
Life Infant Childexpectancy mortali
- Page 163 and 164:
PercentageDaily calorie supplyPopul
- Page 165 and 166:
Number Numberenrolled in enrolled i
- Page 167 and 168:
Percentage share of household incom
- Page 169 and 170:
Average index Tables 4 and 5. Growt
- Page 171 and 172:
28 (minerals, crude fertilizers and
- Page 173 and 174:
continues to grow after replacement
- Page 175 and 176:
posttax income and conceptually tic
- Page 180:
-~~~ S-~~~~~ sEuropean Office:66, a