Table 15. External Public Debt and International ReservesExternal public debtoutstanding and disbursedGross international reservesMillions As percentage Millions In monthsof dollars of GNP of dollars of importcoverage1970 1978 1970 1978a 1970 1978a 1978aLow-Income" ountries 18.1 w 21.7 w 3.5 w1 Kampuchea, Dem. . .. . .2 Bangladesh .. 2,798 . 38.2 . 322 2.33Lao PDR .. .. .. .4 Bhutan5 Ethiopia 169 551 9.5 15.4 72 218 4.46 Mali 238 539 88.1 65.3 1 11 0.57 Nepal 3 88 0.3 5.4 95 181 7.88 Somalia 77 496 41.1 101.7 21 131 4.99 Burundi 7 64 3.1 10.6 15 83 12.810 Chad 32 156 11.8 23.4 2 14 0.911 Mozambique .. .. .. .12 Burma 102 818 4.7 18.1 98 151 3.713 Upper Volta 21 191 6.4 21.6 36 39 2.114 Viet Nam .. .. .. ..15 India 7,936 15,326 14.8 13.1 1,023 8,316 10.216 Malawi 121 390 38.7 36.8 29 77 2.217 Rwanda 2 95 0.9 11.1 8 87 3.718 Sri Lanka 317 1,013 17.1 41.0 43 406 4.419 Guinea 314 916 72.5 81.7 .. .20 Sierra Leone 59 275 14.3 36.1 39 35 1.321 Zaire 311 2,566 17.1 33.4 189 196 1.322 Niger 32 194 8.7 16.2 19 131 3.423 Benin 41 146 16.0 19.5 16 18 0.924 Pakistan 3,059 7,568 30.5 40.8 194 795 2.325 Tanzania 248 1,095 19.4 25.1 65 96 0.926 Afghanistan 547 1,216 58.1 30.8 50 606 10.427 Central African Rep. 19 138 11.2 26.5 1 27 1.528 Madagascar 94 259 10.9 11.7 37 59 1.229 Haiti 40 163 10.3 13.8 4 41 1.630 Mauritania 27 574 16.8 138.1 3 82 2.531 Lesotho 8 28 9.2 7.5 ..32 Uganda 128 252 9.8 3.0 5733 Angola .. .. .. ..34 Sudan 309 2,076 11.6 38.6 22 29 0.435 Togo 40 494 15.4 65.4 35 73 1.536 Kenya 313 953 20.3 17.9 220 369 2.137 Senegal 103 587 12.2 29.8 22 23 0.538 Indonesia 2,443 13,089 27.1 27.6 160 2,676 2.6Middle-income countries lO8w 17. 6 w 2.5 w39 Egypt 1,639 9,879 23.7 71.5 165 1,049 1.940 Ghana 489 843 22.6 5.3 58 330 3.641 Yemen, PDR 1 349 0.3 47.5 60 194 5.642 Cameroon 131 1,167 13.0 30.2 81 57 0.543 Liberia 158 334 49.6 42.3 .. 18 0.544 Honduras 90 591 12.9 34.9 20 187 2.645 Zambia 596 1,396 34.5 51.6 515 96 1.046 Zimbabwe .. .. .. .. ..47 Thailand 322 1,777 4.9 8.2 911 2,559 4.948 Bolivia 477 1,666 46.4 40.7 46 314 3.349 Philippines 633 4,188 9.2 18.0 255 2,104 4.050 Yemen Arab Rep. 147 464 49.9 14.3 .. 1,461 15.351 Congo, People's Rep. 129 726 49.4 85.5 9 11 0.252 Nigeria 478 2,180 6.4 4.5 223 2,037 1.753 Papua New Guinea 36 370 6.2 21.2 . . 431 5.154 El Salvador 88 333 8.6 11.0 63 381 3.555 Morocco 711 5,139 18.6 40.1 141 773 2.256 Peru57 Ivory Coast8482565,3672,81814.018.353.139.53381197384553.31.558 Nicaragua 155 964 20.6 45.8 50 58 0.959 Colombia60 Paraguay1,249982,83344718.116.712.217.4207182,8104678.39.261 Ecuador 213 1,563 13.3 21.5 85 762 4.762 Dominican Rep. 212 724 14.6 16.1 32 176 1.763 Guatemala 106 374 5.7 6.0 80 857 6.064 Syrian Arab Rep. 232 2,091 13.6 26.6 57 622 2.665 Tunisia 545 2,359 38.8 40.5 60 479 2.465 Jordan 118 840 19.0 36.1 258 1,069 6.2138
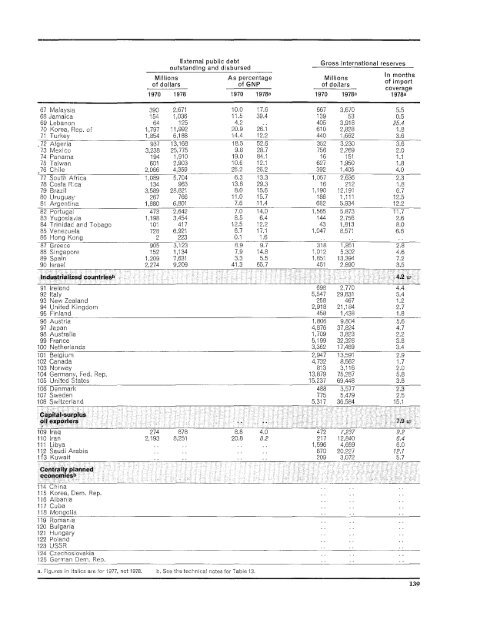
External public debtoutstanding and disbursedGross international reservesMillions As percentage Millions In monthsof dollars of GNP of dollars of importcoverage1970 1978 1970 1978a 1970 1978a 1978a67 Malaysia 390 2,671 10.0 17.6 667 3,670 5.568 Jamaica 154 1,036 11.5 39.4 139 53 0.569 Lebanon 64 125 4.2 .. 405 3,918 25.470 Korea, Rep. of 1,797 11,992 20.9 26.1 610 2,828 1.871 Turkey 1,854 6,188 14.4 12.2 440 1,662 3.672 Algeria 937 13,168 18.5 52.6 352 3,230 3.673 Mexico 3,238 25,775 9.8 28.7 756 2,269 2.074 Panama 194 1,910 19.0 84.1 16 151 1.175 Taiwan 601 2,903 10.6 12.1 627 1,950 1.876 Chile 2,066 4,359 26.2 26.2 392 1,405 4.077 South Africa 1,089 5,704 6.3 13.3 1,057 2,636 2.378 Costa R ca 134 963 13.8 29.3 16 212 1.879 Brazil 3,589 28,821 8.0 15.6 1,190 12,191 6.780 Uruguay 267 766 11.0 15.7 186 1,111 12.581 Argentina 1,880 6,801 7.6 11.4 682 5,934 12.282 Portugal 473 2,642 7.0 14.0 1,565 5,873 11.783 Yugoslavia 1,198 3,454 8.5 6.4 144 2,756 2.684 Trinidac and Tobago 101 417 12.5 12.2 43 1,813 8.085 Venezuela 728 6,921 6.7 17.1 1,047 8,571 6.686 Hong Kong 2 223 0.1 1.687 Greece 905 3,123 8.9 9.7 318 1,851 2.888 Singapore 152 1,134 7.9 14.8 1,012 5,302 4.689 Spain 1,209 7,631 3.3 5.5 1,851 13.394 7.290 Israel 2,274 9,209 41.3 65.7 451 2,890 3.5Industrialized countriesb91 Ireland 698 2,770 4.492 Italy 5,547 29,831 5.493 New Zealand 258 467 1.294 United Kingdom 2,918 21,184 2.795 Finland 458 1,438 1.896 Austria 1,806 9,804 5.697 Japan 4,876 37,824 4.798 Australia 1,709 3,823 2.299 France 5,199 32,328 3.8100 Netherlands 3,362 17,469 3.4101 Belgium 2,947 13,591 2.9102 Canada 4,732 8,562 1.7103 Norway 813 3,116 2.0104 Germanv, Fed. Rep. 13,879 75,287 5.8105 United States 15,237 69,448 3.8106 Denmark 488 3,577 2.3107 Sweden 775 5,479 2.5108 Switzerland 5,317 36,584 15.1Capital-surplusoil exporters109 Iraq 274 878 8.8 4.0 472 7,237 9.2110 Iran 2,193 8,251 20.8 8.2 217 12,840 6.4111 Libya .. . . .. 1,596 4,659 6.0112 Saudi Arabia .. .. .. .. 670 20,227 12.1113 Kuwait .. .. .. . 209 3,072 5.7Centrally plannedeconomiesb114 China115 Korea, Dem. Rep.116 Albania117 Cuba118 Mongolia119 Romania120 Bulgaria121 Hungary122 Poland123 USSR124 Czechoslovakia125 German Dem. Rep.a. Figures in itslics are for 1977, not 1978. b. See the technical notes for Table 13.4.2 w7.9 w139
- Page 1:
t' 8 ~~~~ottoWorld Development Repo
- Page 4 and 5:
Oc 1980 by the International Bankfo
- Page 6 and 7:
ivThis report was prepared by a tea
- Page 8 and 9:
Text tables2.1 Summary of prospects
- Page 10 and 11:
DefinitionsCountry groups in the an
- Page 12 and 13:
illion people have barely enough fa
- Page 14:
in official aid and other capital a
- Page 17 and 18:
production and consumption; in- Tab
- Page 19 and 20:
measures can raise efficiency fairl
- Page 21 and 22:
adjustment; but the increases pro-
- Page 23 and 24:
dustrialized countries' GNP would T
- Page 25 and 26:
windfalls, some of their extra cont
- Page 27 and 28:
e done to increase the supplies Lat
- Page 29 and 30:
exchange-rate depreciation, by perc
- Page 31 and 32:
Table 3.2 World merchandise trade,
- Page 33 and 34:
* Inward-looking policies may exper
- Page 35 and 36:
inward-looking policies, with high
- Page 37 and 38:
cause individual banks or bank- Tab
- Page 39 and 40:
to GNP, of all large industrial na-
- Page 41 and 42:
in Chapter 2). Ways of increasing a
- Page 43 and 44:
4 Poverty, growth and human develop
- Page 45 and 46:
expectancy was less than 50 years,
- Page 47 and 48:
population density (see page 39). e
- Page 49 and 50:
ably could not have been achieved c
- Page 51 and 52:
ution of income typically is less T
- Page 53 and 54:
Table 4.2 Irrigation and income, se
- Page 55 and 56:
ment strategies that assume that in
- Page 57 and 58:
average 40 percent drop out before
- Page 59 and 60:
this may be offset by shifts in the
- Page 61 and 62:
UNESCO concluded that the poorUnemp
- Page 63 and 64:
A typical finding showed the mean o
- Page 65 and 66:
Table5.6 Differences in life tend t
- Page 67 and 68:
are more expensive and less critica
- Page 69 and 70:
per hos pital and clinic, and to st
- Page 71 and 72:
peaks in farm work and widespreadin
- Page 73 and 74:
confined to particular places. In A
- Page 75 and 76:
Indonesia, Colombia and Chilehave r
- Page 77 and 78:
(which respond only gradually to cu
- Page 79 and 80:
Contraceptive technologyresearch in
- Page 81 and 82:
6 Implementing human development pr
- Page 83 and 84:
probably China-have managed Table 6
- Page 85 and 86:
percent of the development bud- dev
- Page 87 and 88:
members, too, as no bureaucraticRur
- Page 89 and 90:
Private costs of using public servi
- Page 91 and 92:
ut not teachers or health workers,
- Page 93 and 94:
7 Priorities and progress in region
- Page 95 and 96:
literacy and life expectancy); andF
- Page 97 and 98: to establish the necessary admin-Fi
- Page 99 and 100: Poverty Figure 7.5 South Asia: life
- Page 101 and 102: and North Africa cover the spec- gr
- Page 103 and 104: The high level of urbanization well
- Page 105 and 106: Chaipter 8 Summary and conclusionsI
- Page 107 and 108: is high, frequently well above that
- Page 109 and 110: Stat.istical appendix to Part ITabl
- Page 111 and 112: Table SA.6 Capital flows and debt o
- Page 113 and 114: Montgomery survey administra- publi
- Page 115 and 116: AnnexWorldDevelopmentIndicators
- Page 117 and 118: Table 13. Balance of Payments and D
- Page 119 and 120: IntroductionThe World Development I
- Page 121 and 122: GNP per capitaAverage indexAverageo
- Page 123 and 124: Average annual growth rate (percent
- Page 125 and 126: Distribution of gross domestic prod
- Page 127 and 128: Average annual growth rate (percent
- Page 129 and 130: Distribution of gross domestic prod
- Page 131 and 132: Distribution of value added (percen
- Page 133 and 134: EnergyEnergyconsumptionAverage annu
- Page 135 and 136: Merchandise tradeAverage annual gro
- Page 137 and 138: Percentage share of merchandise exp
- Page 139 and 140: Percentage share of merchandise imp
- Page 141 and 142: Destination of merchandise exports
- Page 143 and 144: Destination of manufactured exports
- Page 145 and 146: Current accountbalance before Inter
- Page 147: Public and publicly guaranteed medi
- Page 151 and 152: Amount1981a 1982a 1983a 1984a 1985a
- Page 153 and 154: Average annualHypotheticalgrowth of
- Page 155 and 156: PercentageCrude Crude Percentage Pe
- Page 157 and 158: Percentage ofpopulation ofworking a
- Page 159 and 160: Percentage of urban population Numb
- Page 161 and 162: Life Infant Childexpectancy mortali
- Page 163 and 164: PercentageDaily calorie supplyPopul
- Page 165 and 166: Number Numberenrolled in enrolled i
- Page 167 and 168: Percentage share of household incom
- Page 169 and 170: Average index Tables 4 and 5. Growt
- Page 171 and 172: 28 (minerals, crude fertilizers and
- Page 173 and 174: continues to grow after replacement
- Page 175 and 176: posttax income and conceptually tic
- Page 180: -~~~ S-~~~~~ sEuropean Office:66, a