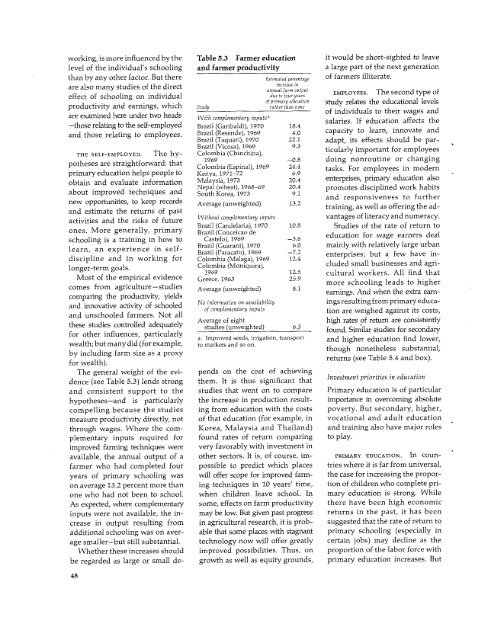
working, is more influenced by the Table 5.3 Farmer education it would be short-sighted to leavelevel of the individual's schooling and farmer productivity a large part of the next generationthan by any other factor. But there Estimated percentage of farmers illiterate.are also many studies of the directincreaseannual farm Gutput EMPLOYEES.effect of schooling on individualThe second type ofdue to four yearsEproductivity and earnings, which Study of primary education study relates the educational levelsproductivity anh earmngs, wohc Study Wrather than none of individuals to their wages andare examined are examined here under two heads W/\ith complementary inputs' salaries. aais If feucto education affects fet theh-those relating to the self-employed Brazil (Garibaldi), 1970 18.4and those relating to employees. Brazil (Resende), 1969 4.0 capacity to learn, innovate andBrazil (Taquari), 1970 22.1 adapt, its effects should be par-Brazil (Vicosa), 1969 9.3 ticularly important for employeesTHE 5ELF-EMPLOYED. 1The hy- Colombia (Chinchina),potheses are straightforward: that 1969 -0.8 doing nonroutine or changingColombia (Espinal), 1969 24.4 tasks. For employees in modernprimary education helps people to Kenya, 1971-72 6.9obtain and evaluate information Malaysia, 1973 20.4 enterprises, primary education alsoabout improved techniques and Nepal (wheat), 1968-69 20.4 promotes disciplined work habitsabout Improved techniques and South Korea, 1973 9.1 and responsiveness to furthernew opportunities, to keep records Average (unweighted) 13.2 training, as well as offering the adactivitiesand the risks of future Without complementary inputsvantages of literacy and numeracy.Brazil (Candelaria), 1970 10.8ones. More generally,Studies of the rateprimaryof return toBrazil (Conceicao deschooling is a training in how to Castelo), 1969 -3.6learn, an experience in self- Brazil (Guarani), 1970 6.0 mainly with relatively large urbanBrazil (Paracatu), 1969 -7.2 enterprises; but a few have indisciplineand in working for Colombia (Malaga), 1969 12.4 edrsmal busines and i-longer-term goals. Colombia (Moniquira), cluded small businesses and agri-1969 12.5 cultural workers. All find thatMost of the empirical evidence Greece, 1963 25.9comes from agriculture-studiescomparing the productivity, yieldsAverage (unweighted) 8.1 eamrings. And when the extra ear-erig.Adwe h xr anandandinnovativeunnshoovedactivityfarmers.of schooledNotllNo information on availabilityof complementary inputsingsresultingtion arefromweighed againstprimary educa-its costs,thes studischontdfaroleds a uatly t Average of eight high rates of return are consistentlythese studies controlled adequately stde studies ,uvegtd (unweighted) 2\ 6L 6.3 found. Similar studies for secondaryfor other influences, particularly a. Improved seeds, irrigation, transport and higher education find lower,wealth; but many did (for example, to markets and so on. though nonetheless substantial,by including farm size as a proxyreturns (see Table 5.4 and box).for wealth).The general weight of the evi- pends on the cost of achieving Investment priorities in educationdence (see Table 5.3) lends strong them. It is thus significant thatand consistent support to the studies that went on to compare Primary education is of particularhypotheses-and is particularly the increase in production result- importance in overcoming absolutecompelling because the studies ing from education with the costs poverty. But secondary, higher,measure productivity directly, not of that education (for example, in vocational and adult educationthrough wages. Where the com- Korea, Malaysia and Thailand) and training also have major rolesplementary inputs required for found rates of return comparing to play.improved farming techniques were very favorably with investment inavailable, the annual output of a other sectors. It is, of course, im- PRIMARY EDUCATION. In counfarmerwho had completed four possible to predict which places tries where it is far from universal,years of primary schooling was will offer scope for improved farm- the case for increasing the proporonaverage 13.2 percent more than ing techniques in 10 years' time, tion of children who complete prionewho had not been to school. when children leave school. In mary education is strong. WhileAs expected, where complementary some, effects on farm productivity there have been high economicinputs were not available, the in- may be low. But given past progress returns in the past, it has beencrease in output resulting from in agricultural research, it is prob- suggested that the rate of return toadditional schooling was on aver- able that some places with stagnant primary schooling (especially inage smaller-but still substantial. technology now will offer greatly certain jobs) may decline as theWhether these increases should improved possibilities. Thus, on proportion of the labor force withbe regarded as large or small de- growth as well as equity grounds, primary education increases. But48
this may be offset by shifts in the And in the few countries where rural areas, girls, and the poorestpattern of production toward more studies have been done at differ- urban boys. In general, primaryskill-intensive goods. In Table 5.4 ent periods, rates of return have education tends to be redistributherates of return to primary usually declined, but only mildly. tive toward the poor (see Tableeducation in countries with adult There are also favorable effects 5.5). In contrast, public expendiliteracyrates above 50 percent, on equity. As primary education ture on secondary and higherwhile somewhat below those in becomes more widespread, addi- education tends to redistributecountries with adult literacy below tional spending will be increas- income from poor to rich, since50 percent, are still strikingly high. ingly concentrated on backward children of poor parents havecomparatively little opportunityTable 5.4 Rates of return to education(percent)to benefit from it.Primary education, especially ofNumber ofCountry group Primary Secondary Higher countriesgirls, has favorable effects on thenext generation's health, fertilityAll developing countries 24.2 15.4 12.3 30 and education (see box overleaf).Low iacome/adult literacyFinally, it enriches peoples' lives.rate under 50 percent, 27.3 17.2 12.1 11Middle income/adult literacyMany would regard this as sufficirateover 50 percent 22.2 14.3 12.4 19 ent justification for universal pri-Industrialized countries .. 10.0 9.1 14 mary education, independent ofNote: In all cases, the figures are "social" rates of return: the costs include forgone earnings its other benefits.(what the students could have earned had they not been in school) as well as both publicand private outlays; the benefits are measured by income before tax. (The "private"returns to individuals exclude public costs and taxes, and are usually larger.) The studies SECONDARY AND HIGHER EDUCATION.refer to various years between 1957 and 1978, mainly in the latter half of the period. Renewed emphasis on the impora.In this sample of 30 developing countries, those countries with low incomes also had tance of primary education, andliteracy rates below 50 percent (at the time the studies were done). All the middle-income its high returns relative to seccountrieshad literacy rates above 50 percent.ondary and higher education,should not start the pendulumswinging too far in the other di-Schooling, screening and productivityrection. High levels of knowledgeare necessary for many people whoThe interpretation of rates of return thus that relative wages are not such serve the poor, both directly asto education-especially secondary and imperfect indicators of productivity, as teachers, health workers and agrihighereducation-is still controversial. It those who have concentrated on their cultural extension workers, andhas often been argued that educational institutional characteristics and determiqualif.cationsare simply a "screening" nants have supposed. In developed indirectly as researchers, technidevice,signaling an individual's produc- countries the relative wages of different cians, managers and administrators.tive qualities to an employer without occupations have gradually but steadily While their skills must be developedactually enhancing them. In some changed in response to increases in the to a considerable extent throughdeveloping countries, moreover, the supply of educated labor. That the samepublic sector-and some heavily protected process operates even in the public sector practhcal experience and i otherparts of the private sector-are the main in developing countries is suggested, for ways, there is for some purposesemployers of university and even second- example, by the fact that the relative no better or cheaper substitute forary-school graduates: it has been sug- salaries of teachers and civil servants the formal disciplines of convengestedthat the salaries they pay are often are much higher in Africa, where edu- tional schooling. Even allowing forartificially inflated and bear little relation cated manpower is much scarcer, thanto relative productivity; and that educa- in Asia, where it is more abundant. doubts about the estimated ratestional requirements serve merely to ration The conventional economic interpre- of return to secondary and higheraccess to these inflated salaries. In both tation of the association between school- education, and for the existencecases, earnings differences associated ing and wages is further strengthened by of some educated unemploymentwith different levels of education would a few studies showing that more educated (see box on next page), there areoverstate the effect of education on workers have increased output in spedficproductivity. manufacturing industries, by evidence unquestonably severe shortagesOn the other side, it is argued that of substantial returns to education even of skilled people in many developingschool "screening" is by no means all in agriculture and other traditional small- countries.wasteful and is preferable to such other scale activities, where one would expect More economical ways of proscreeningmethods as caste or family educational credentials to be much less ducing skilled people need to beconnections. -It is also argued that labor important, and by the macroeconomic found. First, greater use of in-careermarkets are not so monopolistic, and evidence discussed in the box on page 38. and on-th trater shof beon-the-job training should be9and49
- Page 1:
t' 8 ~~~~ottoWorld Development Repo
- Page 4 and 5:
Oc 1980 by the International Bankfo
- Page 6 and 7:
ivThis report was prepared by a tea
- Page 8 and 9: Text tables2.1 Summary of prospects
- Page 10 and 11: DefinitionsCountry groups in the an
- Page 12 and 13: illion people have barely enough fa
- Page 14: in official aid and other capital a
- Page 17 and 18: production and consumption; in- Tab
- Page 19 and 20: measures can raise efficiency fairl
- Page 21 and 22: adjustment; but the increases pro-
- Page 23 and 24: dustrialized countries' GNP would T
- Page 25 and 26: windfalls, some of their extra cont
- Page 27 and 28: e done to increase the supplies Lat
- Page 29 and 30: exchange-rate depreciation, by perc
- Page 31 and 32: Table 3.2 World merchandise trade,
- Page 33 and 34: * Inward-looking policies may exper
- Page 35 and 36: inward-looking policies, with high
- Page 37 and 38: cause individual banks or bank- Tab
- Page 39 and 40: to GNP, of all large industrial na-
- Page 41 and 42: in Chapter 2). Ways of increasing a
- Page 43 and 44: 4 Poverty, growth and human develop
- Page 45 and 46: expectancy was less than 50 years,
- Page 47 and 48: population density (see page 39). e
- Page 49 and 50: ably could not have been achieved c
- Page 51 and 52: ution of income typically is less T
- Page 53 and 54: Table 4.2 Irrigation and income, se
- Page 55 and 56: ment strategies that assume that in
- Page 57: average 40 percent drop out before
- Page 61 and 62: UNESCO concluded that the poorUnemp
- Page 63 and 64: A typical finding showed the mean o
- Page 65 and 66: Table5.6 Differences in life tend t
- Page 67 and 68: are more expensive and less critica
- Page 69 and 70: per hos pital and clinic, and to st
- Page 71 and 72: peaks in farm work and widespreadin
- Page 73 and 74: confined to particular places. In A
- Page 75 and 76: Indonesia, Colombia and Chilehave r
- Page 77 and 78: (which respond only gradually to cu
- Page 79 and 80: Contraceptive technologyresearch in
- Page 81 and 82: 6 Implementing human development pr
- Page 83 and 84: probably China-have managed Table 6
- Page 85 and 86: percent of the development bud- dev
- Page 87 and 88: members, too, as no bureaucraticRur
- Page 89 and 90: Private costs of using public servi
- Page 91 and 92: ut not teachers or health workers,
- Page 93 and 94: 7 Priorities and progress in region
- Page 95 and 96: literacy and life expectancy); andF
- Page 97 and 98: to establish the necessary admin-Fi
- Page 99 and 100: Poverty Figure 7.5 South Asia: life
- Page 101 and 102: and North Africa cover the spec- gr
- Page 103 and 104: The high level of urbanization well
- Page 105 and 106: Chaipter 8 Summary and conclusionsI
- Page 107 and 108: is high, frequently well above that
- Page 109 and 110:
Stat.istical appendix to Part ITabl
- Page 111 and 112:
Table SA.6 Capital flows and debt o
- Page 113 and 114:
Montgomery survey administra- publi
- Page 115 and 116:
AnnexWorldDevelopmentIndicators
- Page 117 and 118:
Table 13. Balance of Payments and D
- Page 119 and 120:
IntroductionThe World Development I
- Page 121 and 122:
GNP per capitaAverage indexAverageo
- Page 123 and 124:
Average annual growth rate (percent
- Page 125 and 126:
Distribution of gross domestic prod
- Page 127 and 128:
Average annual growth rate (percent
- Page 129 and 130:
Distribution of gross domestic prod
- Page 131 and 132:
Distribution of value added (percen
- Page 133 and 134:
EnergyEnergyconsumptionAverage annu
- Page 135 and 136:
Merchandise tradeAverage annual gro
- Page 137 and 138:
Percentage share of merchandise exp
- Page 139 and 140:
Percentage share of merchandise imp
- Page 141 and 142:
Destination of merchandise exports
- Page 143 and 144:
Destination of manufactured exports
- Page 145 and 146:
Current accountbalance before Inter
- Page 147 and 148:
Public and publicly guaranteed medi
- Page 149 and 150:
External public debtoutstanding and
- Page 151 and 152:
Amount1981a 1982a 1983a 1984a 1985a
- Page 153 and 154:
Average annualHypotheticalgrowth of
- Page 155 and 156:
PercentageCrude Crude Percentage Pe
- Page 157 and 158:
Percentage ofpopulation ofworking a
- Page 159 and 160:
Percentage of urban population Numb
- Page 161 and 162:
Life Infant Childexpectancy mortali
- Page 163 and 164:
PercentageDaily calorie supplyPopul
- Page 165 and 166:
Number Numberenrolled in enrolled i
- Page 167 and 168:
Percentage share of household incom
- Page 169 and 170:
Average index Tables 4 and 5. Growt
- Page 171 and 172:
28 (minerals, crude fertilizers and
- Page 173 and 174:
continues to grow after replacement
- Page 175 and 176:
posttax income and conceptually tic
- Page 180:
-~~~ S-~~~~~ sEuropean Office:66, a