

World Bank Document
World Bank Document
World Bank Document
- No tags were found...

Create successful ePaper yourself
Turn your PDF publications into a flip-book with our unique Google optimized e-Paper software.
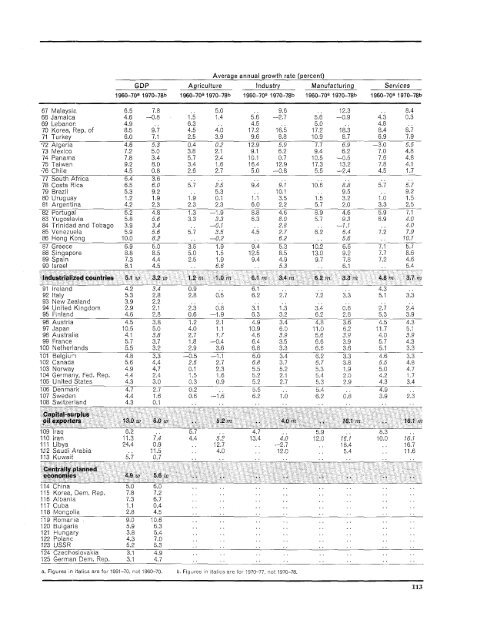
Average annual growth rate (percent)GDP Agriculture Industry Manufacturing Services1960- 7 Oa 1970-78b 1960 -. 70a 1970-78b 1960-.7Oa 1970-78b 1960-70a 1970-78b 1960-70a 1970-78b67 Malaysiza 6.5 7.8 . 5.0 .. 9.6 .. 12.3 .. 8.468 Jamaica 4.6 -0.8 1.5 1.4 5.6 -2.7 5.6 -0.9 4.3 0.369 Lebanor: 4.9 .. 6.3 .. 4.5 .. 5.0 .. 4.870 Korea, Rep. of 8.5 9.7 4.5 4.0 17.2 16.5 17.2 18.3 8.4 8.771 Turkey 6.0 7.1 2.5 3.9 9.6 8.8 10.9 8.7 6.9 7.9'72 Algeria 4.6 5.3 0.4 0.2 12.9 5.9 7.7 6.9 -3.0 5.573 Mexico 7.2 5.0 3.8 2.1 9.1 5.2 9.4 6.2 7.0 4.874 Panama 7.8 3.4 5.7 2.4 10.1 0.7 10.5 -0.5 7.6 4.875 Taiwan 9.2 8.0 3.4 1.6 16.4 12.9 17.3 13.2 7.8 4.1-76 Chile 4.5 0.8 2.6 2.7 5.0 -0.8 5.5 -2.4 4.5 1.777 South A4frica 6.4 3.6 . ... .78 Costa Rica 6.5 6.0 5.7 2.5 9.4 9.1 10.6 8.8 5.7 5.779 Brazil 5.3 9.2 .. 5.3 .. 10.1 . 9.5 .. 9.280 Uruguayi 1.2 1.9 1.9 0.1 1.1 3.5 1.5 3.2 1.0 1.581 Argentinia 4.2 2.3 2.3 2.3 6.0 2.2 5.7 2.0 3.3 2.582Portugal 6.2 4.8 1.3 -1.9 8.8 4.6 8.9 4.6 5.9 7.183 Yugoslavia 5.8 5.6 3.3 3.3 6.3 8.0 5.7 9.3 6.9 4.084 Trinidaci and Tobago 3.9 3.4 . . -0. I. 2.8 . . -1.1 . 4.085 Venezuela 5.9 5.6 5.7 3.5 4.5 2.7 6.2 6.4 7.2 7.986 Hong Kong 10.0 8,2 . . -0.2 .. 6.2 .. 5.6 .. 10.18K7 Greece 6.9 5.0 3.5 1.9 94 5.3 10.2 6.6 7.1 5.788 Singapore 8.8 8.5 5.0 1.5 12.5 8.5 13.0 9.2 7.7 8.689 Spain 7.3 4.4 2.5 1.9 9.4 4.9 9.7 7.8 7.2 4.690 Israel 8.1 4.5 .. 6.6 .. 5.3 . 6.1 .. 5.4Industrialized countries 5.1 w 3.2 w 1.2 rn 1.0 m 6.1 m 3.4 m 6.2 m 3.3 rn 4.8 m 3.7 m9§1 I-relIa nd 4.2 3.4 0.9 .. 6.1 ... .4.392 Italy 5.3 2.8 2.8 0.5 6.2 2.7 7.2 3.3 5.1 3.393 New Zealand 3.9 2.2 . .. ..94 United Kingdom 2.9 2.1 2.3 0.8 3.1 1.3 3.4 0.5 2.7 2.495 Finland 4.6 2.8 0.6 -1.9 6.3 3.2 6.2 2.8 5.3 3.996 Austria 4.5 3.8 1.2 2.1 4.9 3.4 4.8 3.6 4.5 4.397 Japan 10.5 5.0 4.0 1.1 10.9 6.0 11.0 6.2 11.7 5.198 Australia 4.1 3.8 2.7 1.7 4.6 3.9 5.6 3.9 4.0 3.999 France 5.7 3.7 1.8 -0.4 6.4 3.5 5.6 3.9 5.7 4.3100 Netherlands 5.5 3.2 2.9 3.6 6.8 3.3 6.5 3.6 5.1 3.31-01 -Belgium 4.8 3.3 -0.5 -1.1 6.0 3.4 6.2 3.3 4.6 3.3102 Canada 5.6 4.4 2.5 2.7 6.8 3.7 6.7 3.8 5.5 4.8103 Norway 4.9 4.7 0.1 2.3 5.5 5.2 5.3 1.9 5.0 4.7104 Germaniy, Fed. Rep, 4.4 2.4 1.5 1.6 5.2 2.1 5.4 2.0 4.2 1.7105 United States 4.3 3.0 0.3 0.9 5.2 2.7 5.3 2.9 4.3 3.4106 -Den mark 4.7 2.7 0.2 .. 5.5 .. 5.4 .. 4.9107 Swederl 4.4 1.6 0.6 -1.6 6.2 11.0 6.2 0.8 3.9 2.3108 Switzerland 4.3 0.1 . .. ..Capital-surplusoil exporters 13.0 w 6.0 w .. 5.2 m .. 4.0 m .. 16.1 Ini . 16.1 mn109 Iraq 6.2 .. 5.7 .. 4.7 .5.9 .. 8.3110 Iran 11.3 7.4 4.4 5.2 13.4 4.0 12.0 16.1 10.0 16.1111 Libya 24.4 0.9 .. 12.7 .. -2.7 .. 18.4 .. 16.71.12Saudi Arabia .. 11.5 .. 4.0 .. 12.0 .. 5.4 .. 11.6113 Kuwait 5.7 0.7 . ... . . .Centrally plannedeconomies 4.9 w 5.6 w . .. ..114 China 5.0 6.0 . .. ..115 Korea, Dem. Rep. 7.8 7.2 . ... .. .116 Albani-a 7.3 6.7.. . . .. .117 Cuba 1.1 0.4 ... ... .118 Mongolia 2.8 4.5.. . . ... .119 Romaria 9.0 10.6 . .. ..120 Bulgaria 5.9 6.3 . ... ... .121 H ungary 3.8 5.4.. ... ... .122 Poianc 4.3 7.0.. ... ... .123 USSR 5.2 5.3124 ~Czech-oslovakia 3.1 4.9.. ... . ..125 German Dem. Rep. 3.1 4.7.. ... . ..a. Figures in italics are for 1961-70, not 1960-70. b. Figures in italics are for 1970-77, not 1970-78.113


