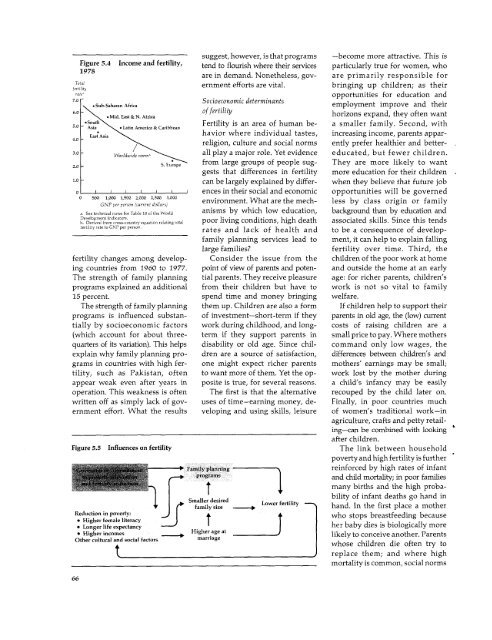
Figure 5.4 Income and fertility,suggest, however, is that programstend to flourish where their services-become more attractive. This isparticularly true for women, whoare in demand. Nonetheless, gov- are primarily responsible forfeTotlflalS ernment efforts are vital. bringing up children; as theirrot,opportunities for education and7.0 Sub aharan Africaocioeconoic determinnts employment improve and their6.0 Mid East&N Africa of fertility horizons expand, they often want5.0 ASouthi Fertility is an area of human be- a smaller family. Second, withAsia Latin America & CaribbeanEast1Asia \havior where individual tastes, increasing income, parents appar-4.0 - > religion, culture and social norms ently prefer healthier and better-3.0 - <strong>World</strong>wide norm all play a major role. Yet evidence educated, but fewer children.2.0 - S.Ear~ from large groups of people sug- They are more likely to wantgests that differences in fertility more education for their children1.o - can be largely explained by differ- when they believe that future job00 X 1 1 1 1e500 1s0o 3,500 2,000 2,500 3,0001 ences in their social and economicenvironment. What are the mechopportunitieswill be governedless by class origin or familyGNP pe, person (cu,rewl doUoar5)ao "technical notes for Table 180 f the <strong>World</strong> anisms by which low education, background than by education andDevel,pmrnotIndcaor,tfeetilityrotetocGNprrperson.q-tielati,gt.t.1 poor living conditions, high deathrates and lack of health andassociated skills. Since this tendsto be a consequence of developfamilyplanning services lead to ment, it can help to explain fallinglarge families? fertility over time. Third, thefertility changes among develop- Consider the issue from the children of the poor work at homeing countries from 1960 to 1977. point of view of parents and poten- and outside the home at an earlyThe strength of family planning tial parents. They receive pleasure age: for richer parents, children'sprograms explained an additional from their children but have to work is not so vital to family15 percent. spend time and money bringing welfare.The strength of family planning them up. Children are also a form If children help to support theirprograms is influenced substan- of investment-short-term if they parents in old age, the (low) currenttially by socioeconomic factors work during childhood, and long- costs of raising children are a(which account for about three- term if they support parents in small price to pay. Where mothersquarters of its variation). This helps disability or old age. Since chil- command only low wages, theexplain why family planning pro- dren are a source of satisfaction, differences between children's andgrams in countries with high fer- one might expect richer parents mothers' earnings may be small;tility, such as Pakistan, often to want more of them. Yet the op- work lost by the mother duringappear weak even after years in posite is true, for several reasons. a child's infancy may be easilyoperation. This weakness is often The first is that the alternative recouped by the child later on.written off as simply lack of gov- uses of time-earning money, de- Finally, in poor countries muchernment effort. What the results veloping and using skills, leisure of women's traditional work-inagriculture, crafts and petty retailing-canbe combined with lookingafter children.Figure 5.5 Influences on fertilityThe link between householdpoverty and high fertility is furthermily planningreinforced by high rates of infantprograms~~~~~~~and child mortality; in poor familiesmany births and the high probamaIlerdesiredSmaller desired Lower fertilitybility of infant deaths go hand inhand. In the first place a motherReduction in poverty: A who stops breastfeeding because* Higher female literacy l her baby dies is biologically more* Longer lifctancy Higher age atOther cultural and social factors marriageI likely to conceive another. Parents66t , replace them; and where highmortality is common, social norms
(which respond only gradually to cultural or religious differences. program to reduce populationchanges in mortality) tend to en- But culture never seems to have growth.courage "insurance" against the been an impenetrable barrier to In Latin America, later marriageexpected loss of children. On the fertility change. Once a high enough has been a less important ingredientother hand, high fertility contrib- level of development has been of declining fertility.This has beenutes to high infant and child mor- reached, fertility has fallen without partly because average age at martality:rmany births, especially if exception. Where there was a strong riage was already high comparedthey are close together, can weaken religious or cultural resistance to with Asia, partly because muchboth mother and children. contraception, as in Ireland, fertility of the fertility decline in suchfell through delays in the age at countries as Chile, Colombia andFAMILY PLANNING. The link be- marriage and an increase in life- Costa Rica has been among oldertween household poverty and high long celibacy, rather than through women, and partly because childratesof childbearing is further family planning. bearing outside wedlock is morecemented by the fact that the poorcommon. Fertility is generallystill have very limited access to AGE AT MARRIAGE. Recent de- high and age at marriage lowmodern and simple means of clines in birth rates partly reflect throughout Africa and the Middlecontraception. The contraceptives rising age of marriage among East.available are often expensive, par- women. This has lowered the rateticularly in relation to the incomes of population growth by lengthening Population policy and familyof the poor-and especially if they the interval between generations, planning programsmust be bought from private by shortening the period during Lower fertility is not an end indoctors. For a poor family, limiting which women are likely to have itself, but one among several waysthe number of children may there- babies, and perhaps by giving of improving human welfare. Norfore mean sexual abstinence, women other interests beyond arethebenefitsoffamilyplanningillegal abortion, infanticide-or, family and childbearing to take simply economic. Relatively fewat best, ineffective and difficult with them into married life. couples, even among the poor, wanttraditional contraception. In some Like marital fertility, age at as many children as their naturalcircumstances, the psychological marriage is strongly affected by fertility would allow-witness theor financial costs of avoiding social and economic conditions, hospitalization rates due to selfpregnancymay exceed the costs including women's education and induced abortion in Latin America,of having another child. employment opportunities. The and scattered evidence that someFamily planning programs that average age at marriage (corrected parents do not always do all theyare well designed and implemented for the proportion of women who might to avoid infant deaths,may legitimize what relatives, never marry) is 22 in the middle- particularly of daughters. Poorfriends, the community, the clan income countries of Latin America women are particularly helped byor village might otherwise have and in Malaysia, Singapore and family planning services; so arefrowned upon. These social norms South Korea; but it is less than children, who can benefit from aare often influential. Recent evi- 20 (sometimes much less) in many smaller family.dence indicates that declining Sub-Saharan African countries The case for the public provisionfertility in 19th century Europe and in Nepal, India, Pakistan and of family planning services, andwas not associated with economic Bangladesh. ensuring that the poor have accessfactors in any consistent way. But Later marriage as a mechanism to them, is gradually becoming lessit did follow a similar pattem across of fertility reduction has been most controversial. Some 35 developingregions defined by a common important in Asia. In the 1960s countries, with 78 percent of thelanguage or culture-implying that in South Korea and Peninsular developing world's people, havethe idea of limiting family size Malaysia, changes in the proportion an official policy to reduce populacanaffect fertility independently of women married accounted for tion growth. An additional 14of specific economic change. about half as much of the decline percent of the developing world'sThe same tendency can be seen in the crude birth rate as did changes population lives in countries wheretoday: even taking income and in marital fertility-and were more family planning is supported foreducation differences into account, important than marital fertility reasons of health and welfarethereare national and regional declines in Sri Lanka and the including the health benefits thatdifferences in fertility (Figure 5.4) Philippines. China has placed great come from fewer children.that appear largely the product of stress on delaying marriage in its Some countries have had striking67
- Page 1:
t' 8 ~~~~ottoWorld Development Repo
- Page 4 and 5:
Oc 1980 by the International Bankfo
- Page 6 and 7:
ivThis report was prepared by a tea
- Page 8 and 9:
Text tables2.1 Summary of prospects
- Page 10 and 11:
DefinitionsCountry groups in the an
- Page 12 and 13:
illion people have barely enough fa
- Page 14:
in official aid and other capital a
- Page 17 and 18:
production and consumption; in- Tab
- Page 19 and 20:
measures can raise efficiency fairl
- Page 21 and 22:
adjustment; but the increases pro-
- Page 23 and 24:
dustrialized countries' GNP would T
- Page 25 and 26: windfalls, some of their extra cont
- Page 27 and 28: e done to increase the supplies Lat
- Page 29 and 30: exchange-rate depreciation, by perc
- Page 31 and 32: Table 3.2 World merchandise trade,
- Page 33 and 34: * Inward-looking policies may exper
- Page 35 and 36: inward-looking policies, with high
- Page 37 and 38: cause individual banks or bank- Tab
- Page 39 and 40: to GNP, of all large industrial na-
- Page 41 and 42: in Chapter 2). Ways of increasing a
- Page 43 and 44: 4 Poverty, growth and human develop
- Page 45 and 46: expectancy was less than 50 years,
- Page 47 and 48: population density (see page 39). e
- Page 49 and 50: ably could not have been achieved c
- Page 51 and 52: ution of income typically is less T
- Page 53 and 54: Table 4.2 Irrigation and income, se
- Page 55 and 56: ment strategies that assume that in
- Page 57 and 58: average 40 percent drop out before
- Page 59 and 60: this may be offset by shifts in the
- Page 61 and 62: UNESCO concluded that the poorUnemp
- Page 63 and 64: A typical finding showed the mean o
- Page 65 and 66: Table5.6 Differences in life tend t
- Page 67 and 68: are more expensive and less critica
- Page 69 and 70: per hos pital and clinic, and to st
- Page 71 and 72: peaks in farm work and widespreadin
- Page 73 and 74: confined to particular places. In A
- Page 75: Indonesia, Colombia and Chilehave r
- Page 79 and 80: Contraceptive technologyresearch in
- Page 81 and 82: 6 Implementing human development pr
- Page 83 and 84: probably China-have managed Table 6
- Page 85 and 86: percent of the development bud- dev
- Page 87 and 88: members, too, as no bureaucraticRur
- Page 89 and 90: Private costs of using public servi
- Page 91 and 92: ut not teachers or health workers,
- Page 93 and 94: 7 Priorities and progress in region
- Page 95 and 96: literacy and life expectancy); andF
- Page 97 and 98: to establish the necessary admin-Fi
- Page 99 and 100: Poverty Figure 7.5 South Asia: life
- Page 101 and 102: and North Africa cover the spec- gr
- Page 103 and 104: The high level of urbanization well
- Page 105 and 106: Chaipter 8 Summary and conclusionsI
- Page 107 and 108: is high, frequently well above that
- Page 109 and 110: Stat.istical appendix to Part ITabl
- Page 111 and 112: Table SA.6 Capital flows and debt o
- Page 113 and 114: Montgomery survey administra- publi
- Page 115 and 116: AnnexWorldDevelopmentIndicators
- Page 117 and 118: Table 13. Balance of Payments and D
- Page 119 and 120: IntroductionThe World Development I
- Page 121 and 122: GNP per capitaAverage indexAverageo
- Page 123 and 124: Average annual growth rate (percent
- Page 125 and 126: Distribution of gross domestic prod
- Page 127 and 128:
Average annual growth rate (percent
- Page 129 and 130:
Distribution of gross domestic prod
- Page 131 and 132:
Distribution of value added (percen
- Page 133 and 134:
EnergyEnergyconsumptionAverage annu
- Page 135 and 136:
Merchandise tradeAverage annual gro
- Page 137 and 138:
Percentage share of merchandise exp
- Page 139 and 140:
Percentage share of merchandise imp
- Page 141 and 142:
Destination of merchandise exports
- Page 143 and 144:
Destination of manufactured exports
- Page 145 and 146:
Current accountbalance before Inter
- Page 147 and 148:
Public and publicly guaranteed medi
- Page 149 and 150:
External public debtoutstanding and
- Page 151 and 152:
Amount1981a 1982a 1983a 1984a 1985a
- Page 153 and 154:
Average annualHypotheticalgrowth of
- Page 155 and 156:
PercentageCrude Crude Percentage Pe
- Page 157 and 158:
Percentage ofpopulation ofworking a
- Page 159 and 160:
Percentage of urban population Numb
- Page 161 and 162:
Life Infant Childexpectancy mortali
- Page 163 and 164:
PercentageDaily calorie supplyPopul
- Page 165 and 166:
Number Numberenrolled in enrolled i
- Page 167 and 168:
Percentage share of household incom
- Page 169 and 170:
Average index Tables 4 and 5. Growt
- Page 171 and 172:
28 (minerals, crude fertilizers and
- Page 173 and 174:
continues to grow after replacement
- Page 175 and 176:
posttax income and conceptually tic
- Page 180:
-~~~ S-~~~~~ sEuropean Office:66, a