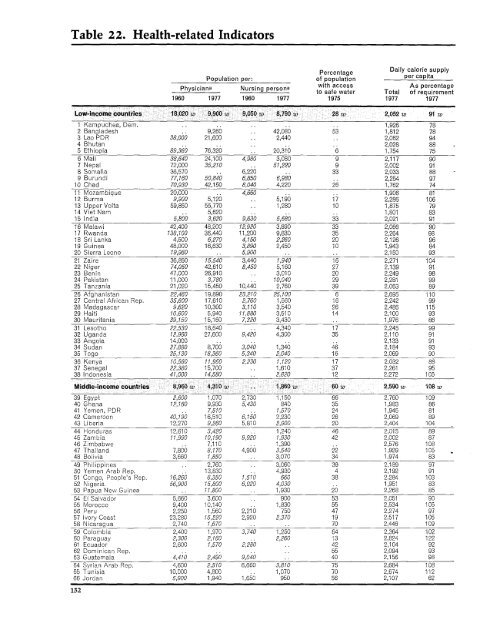
Table 22. Health-related IndicatorsPercentageDaily calorie supplyPopulation per: of population per capitaPhysiciana Nursing persona with accessto safe water TotalAs percentageof requirement1960 1977 1960 1977 1975 1977 1977Low-icome countrie 18,020 w 9,90 w ,00O ,70 2 2,052 w 91 w1 Kampuchea, Dem. 1,926 782 Bangladesh 9,260 42,080 53 1,812 783 Lao PDR 38,000 21,600 2,440 .. 2,082 944 Bhutan ,.2,028 885 Ethiopia 89,360 76,320 20,310 6 1,754 756 Mali 38,640 24,100 4,980 3,080 9 2,117 907 Nepal 72,000 35,210 51,220 9 2,002 918 Somalia 36,570 6,220 33 2,033 889 Burundi 77,160 50,840 6,850 6,980 .. 2,254 9710 Chad 70,930 42,150 8,040 4,220 26 1,762 7411 Mozambique 20,000 4,660 1,906 8112 Burma 9,900 5,120 .. 5,190 17 2,286 10613 Upper Volta 59,850 55,770 .. 1,280 10 1,875 7914 Viet Nam 5,620 . .1,801 8315 India 5,800 3,620 9,630 5,680 33 2,021 9116 Malawi 42,400 48,200 12,920 3,890 33 2,066 9017 Rwanda 138,100 36,440 11,200 9,830 35 2,264 9818 Sri Lanka 4,500 6,270 4,150 2,260 20 2,126 9619 Guinea 48,000 16,630 3,890 2,450 10 1,943 8420 Sierra Leone 19,960 .. 5,900 ... 2,150 9321 Zaire 36,850 15,540 3,440 1,940 16 2,271 10422 Niger 74,050 42,610 8,450 5,160 27 2,139 9123 Benin 47,000 26,910 .. 3,010 20 2,249 9824 Pakistan 11,000 3,780 .. 10,040 29 2,281 9925 Tanzania 21,020 15,450 10,440 2,760 39 2,063 8926 Afghanistan 22,460 19,890 23,210 25,100 6 2,695 11027 Central African Rep. 35,600 17,610 2,760 1,560 16 2,242 9928 Madagascar 9,620 10,300 3,110 3,540 26 2,485 11529 Haiti 10,600 5,940 11,880 3,510 14 2,100 9330 Mauritania 39,150 15,160 7,320 3,430 .. 1,976 8631 Lesotho 22,530 18,640 .. 4,340 17 2,245 9932 Uganda 12,960 27,60033 Angola 14,000 ......9,420 4,300 35 2,1102,133919134 Sudan 27,880 8,700 3,040 1,340 46 2,184 9336 Togo 35,130 18,360 5,340 2,040 16 2,069 9036 Kenya 10,560 11,950 2,230 1,120 17 2,032 8837 Senegal 22,380 15,700 .. 1,610 37 2,261 9538 Indonesia 41,000 14,580 .. 2,820 12 2,272 105Middlle-ilncome~ countries 80 wi 4,310 Dw 1,860 w 60 w2,590 w 108 wo39 Egypt 2,600 1,070 2,730 1,150 66 2,760 10940 Ghana 12,160 9,930 5,430 840 35 1,983 8641 Yemen, PDR .. 7,510 .. 1,570 24 1,945 8142 Cameroon 40,190 16,510 6,150 2,230 26 2,069 8943 Liberia 12,270 9,260 5,810 2,900 20 2,404 10444 Honduras 12,610 3,420 .. 1,240 46 2,015 8945 Zambia 11,990o 10,190 .9,920 1,9P30 42 2,002 8746 Zimbabwe .. 7,110 .. 1,390 .. 2,576 10847 Thailand 7,800 8,170 4,900 3,540 22 1,929 10548 Bolivia 3,660 1,850 .. 3,070 34 1,974 8349 Philippines .. 2,760 .. 3,060 39 2,189 9750 Yemen Arab Rep. 13,830 4,930 4 2,192 9151 Congo, People's Rep. 16,260 6,350 1,510 660 38 2,284 10352 Nigeria 56,900 15,800 6,020 4,030 1,951 8353 Papua New Guinea . 11,800 . 1,930 20 2,268 8554 El Salvador 5,660 3,600 .. 900 53 2,051 9055 Morocco 9,400 10,140 .. 1,830 55 2,534 10556 Peru 2,250 1,560 2,210 750 47 2,274 9757 Ivory Coast 23,280 15,220 2,920 2,370 19 2,517 10558 Nicaragua 2,740 1,670 -.. 70 2,446 10959 Colomnbia 2,400 1,970 3,740 1,250 64 2,364 10260 Paraguay 2,300 2,160 .. 2,260 13 2,824 12261 Ecuador 2,600 1,570 2,280 .. 42 2,104 9262 Dominican Rep. ... .55 2,094 9363 Guatemala 4,410 2,490- 9,040 .40 2,156 9864 Syrian Arab Rep. 4,600 2,510 6,660 3,810 75 2,684 10865 Tunisia 10,000 4,800 .. 1,070 70 2,674 11266 Jordan 5,900 1,940 1,650 950 56 2,107 62152
PercentageDaily calorie supplyPopulation per: of population per capitaPhysiciana Nursing persona with access As percentageto safe water Total of requirement1960 1977 1960 1977 1975 1977 197767 Maiays;a 6,940 4,350 1,780 1,080 62 2,610 11768 Jamaicia 2,600 3,520 550 86 2,660 11969 Lebanon 2,495 10170 Korea, Rep. of 3,000 1,960 510 62 2,785 11971 Turkey 3,000 1,770 1,400 75 2,907 11572 Algeria .. 5,360 .. 1,490 77 2,372 9973 Mexico 1,700 1,820 1,400 62 2,654 11474 Panamia 2,700 1,260 .. 1,450 79 2,341 10175 Taiwan 2,330 1,570 7,550 1,760 2,805 12076 Chile 1,810 1,~620 650 450 84 2,656 10977 -SoLth Africa 2,090 540 .. 2,831 11678 Costa Rica 2,600 1,390 1,700 450 77 2,550 11479 Brazil 3,600 1,700 77 2,562 10780 Uruguaty 960 710 .. 98 3,036 11481 Argentina 660 530 . .66 3,347 12682 Portugial 1,200 710 1,430 500 65 3,076 12683 Yugoslavia 1,620 760 1,350 410 3,445 13684 Trinidad and Tobago) 2,570 1,970 580 2,694 ill85 Venezuela 1,430 930 1,890 380 2,435 9986 Hong Kong 2,990 1,280 2,950 970 2,883 12687 Greece 7,90 450 2,080 600 3,400 13688 Singapore 2,400 1,260 650 340 100 3,074 13489 Spain 820 550 .. 900 3,149 12890 Israel 410 .. 360 -. 3,141 122Industrialized countries 820 wo 630 wo 220 wo 3,377 w 131 w91 Ireland 950 830 180 200 .. 3,541 14192 Italy 640 490 920 330 .. 3,428 13693 New ZeDaland 690 740 .. 200 .. 3,345 12794 United Kingdomn 1,100 750 420 300 .. 3,336 13295 Finlandi 1,570 620 220 110 .3,100 11496 Austriai 550 430 400 260 .. 3,535 13497 Japan 920 850 460 290 .. 2,949 12698 Australia 860 650 120 .. 3,428 12999 France 930 610 530 170 *.3,434 136100 Netherlands 900 580 .. 270 .. 3,338 124101 Belgium 780 470 .. 250 .. 3,583 136102 Canada 910 560 300 130 .. 3,374 127103 Norway 850 540 330 100 .. 3,175 118104 Germany, Fed. Rep. 670 490 450 260 .. 3,381 127105 United States 760 580 340 150 .. 3,576 135106 Denmark 810 510 270 170 .. 3,418 127107 Sweden 1,150 560 .. 130 .. 3,221 120108 Switzerland 740 500 390 220 .. 3,485 130Capital-surplus-oil exporters5 ,4 70Ow l,830 w 1,7 7 0 w 8 2,963 w 115 w109 Iraq 5,600 2,230 6,680 2,860 62 2,134 89110 Iran 3,800 . .51 3,138 130111 Libya 5,800 900 2,390 290 100 2,985 126112 Saudi Arabia 13,000 1,690 .. 850 64 2,624 88113 Kuwait 760 790 190 270 89Centrally plannedeconomies 640 wo 390 wo 410 wo 240 u7 2,752 wo 114 so114 China ... .. .2,467 105115 Korea, IDem. Rep. . .... .2,837 121116 Albania 2,860 960 540 370 .. 2,730 113117 Cuba 1,200 1,100 910 ... 2,720 118118 Mongolia 1,010 480 290 250 . 2,523 104119 Roma~ia 780 730 620 640 .. 3,444 130120 Bulgaria 640 440 550 220 .. 3,611 144121 H ungary 640 430 440 200 .. 3,521 134122 Poland -940 610 490 260 .. 3,656 140123 USSR 520 300 340 210 .. 3,460 135124 -Czechoslovakia 590 390 230 160 .. 3,340 139125 German Dem. Rep. 950 520 .... 3,641 139a. Figures i i italics are for years other than those specified. See the technical notes.153
- Page 1:
t' 8 ~~~~ottoWorld Development Repo
- Page 4 and 5:
Oc 1980 by the International Bankfo
- Page 6 and 7:
ivThis report was prepared by a tea
- Page 8 and 9:
Text tables2.1 Summary of prospects
- Page 10 and 11:
DefinitionsCountry groups in the an
- Page 12 and 13:
illion people have barely enough fa
- Page 14:
in official aid and other capital a
- Page 17 and 18:
production and consumption; in- Tab
- Page 19 and 20:
measures can raise efficiency fairl
- Page 21 and 22:
adjustment; but the increases pro-
- Page 23 and 24:
dustrialized countries' GNP would T
- Page 25 and 26:
windfalls, some of their extra cont
- Page 27 and 28:
e done to increase the supplies Lat
- Page 29 and 30:
exchange-rate depreciation, by perc
- Page 31 and 32:
Table 3.2 World merchandise trade,
- Page 33 and 34:
* Inward-looking policies may exper
- Page 35 and 36:
inward-looking policies, with high
- Page 37 and 38:
cause individual banks or bank- Tab
- Page 39 and 40:
to GNP, of all large industrial na-
- Page 41 and 42:
in Chapter 2). Ways of increasing a
- Page 43 and 44:
4 Poverty, growth and human develop
- Page 45 and 46:
expectancy was less than 50 years,
- Page 47 and 48:
population density (see page 39). e
- Page 49 and 50:
ably could not have been achieved c
- Page 51 and 52:
ution of income typically is less T
- Page 53 and 54:
Table 4.2 Irrigation and income, se
- Page 55 and 56:
ment strategies that assume that in
- Page 57 and 58:
average 40 percent drop out before
- Page 59 and 60:
this may be offset by shifts in the
- Page 61 and 62:
UNESCO concluded that the poorUnemp
- Page 63 and 64:
A typical finding showed the mean o
- Page 65 and 66:
Table5.6 Differences in life tend t
- Page 67 and 68:
are more expensive and less critica
- Page 69 and 70:
per hos pital and clinic, and to st
- Page 71 and 72:
peaks in farm work and widespreadin
- Page 73 and 74:
confined to particular places. In A
- Page 75 and 76:
Indonesia, Colombia and Chilehave r
- Page 77 and 78:
(which respond only gradually to cu
- Page 79 and 80:
Contraceptive technologyresearch in
- Page 81 and 82:
6 Implementing human development pr
- Page 83 and 84:
probably China-have managed Table 6
- Page 85 and 86:
percent of the development bud- dev
- Page 87 and 88:
members, too, as no bureaucraticRur
- Page 89 and 90:
Private costs of using public servi
- Page 91 and 92:
ut not teachers or health workers,
- Page 93 and 94:
7 Priorities and progress in region
- Page 95 and 96:
literacy and life expectancy); andF
- Page 97 and 98:
to establish the necessary admin-Fi
- Page 99 and 100:
Poverty Figure 7.5 South Asia: life
- Page 101 and 102:
and North Africa cover the spec- gr
- Page 103 and 104:
The high level of urbanization well
- Page 105 and 106:
Chaipter 8 Summary and conclusionsI
- Page 107 and 108:
is high, frequently well above that
- Page 109 and 110:
Stat.istical appendix to Part ITabl
- Page 111 and 112: Table SA.6 Capital flows and debt o
- Page 113 and 114: Montgomery survey administra- publi
- Page 115 and 116: AnnexWorldDevelopmentIndicators
- Page 117 and 118: Table 13. Balance of Payments and D
- Page 119 and 120: IntroductionThe World Development I
- Page 121 and 122: GNP per capitaAverage indexAverageo
- Page 123 and 124: Average annual growth rate (percent
- Page 125 and 126: Distribution of gross domestic prod
- Page 127 and 128: Average annual growth rate (percent
- Page 129 and 130: Distribution of gross domestic prod
- Page 131 and 132: Distribution of value added (percen
- Page 133 and 134: EnergyEnergyconsumptionAverage annu
- Page 135 and 136: Merchandise tradeAverage annual gro
- Page 137 and 138: Percentage share of merchandise exp
- Page 139 and 140: Percentage share of merchandise imp
- Page 141 and 142: Destination of merchandise exports
- Page 143 and 144: Destination of manufactured exports
- Page 145 and 146: Current accountbalance before Inter
- Page 147 and 148: Public and publicly guaranteed medi
- Page 149 and 150: External public debtoutstanding and
- Page 151 and 152: Amount1981a 1982a 1983a 1984a 1985a
- Page 153 and 154: Average annualHypotheticalgrowth of
- Page 155 and 156: PercentageCrude Crude Percentage Pe
- Page 157 and 158: Percentage ofpopulation ofworking a
- Page 159 and 160: Percentage of urban population Numb
- Page 161: Life Infant Childexpectancy mortali
- Page 165 and 166: Number Numberenrolled in enrolled i
- Page 167 and 168: Percentage share of household incom
- Page 169 and 170: Average index Tables 4 and 5. Growt
- Page 171 and 172: 28 (minerals, crude fertilizers and
- Page 173 and 174: continues to grow after replacement
- Page 175 and 176: posttax income and conceptually tic
- Page 180: -~~~ S-~~~~~ sEuropean Office:66, a