World Bank Document
World Bank Document
World Bank Document
- No tags were found...
Create successful ePaper yourself
Turn your PDF publications into a flip-book with our unique Google optimized e-Paper software.
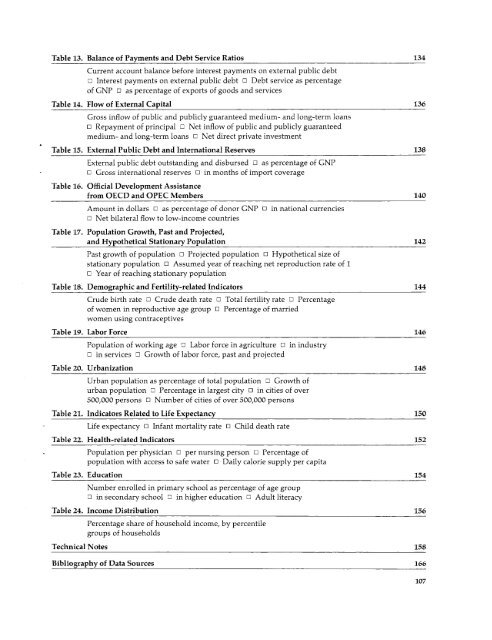
Table 13. Balance of Payments and Debt Service Ratios 134Current account balance before interest payments on external public debtn Interest payments on external public debt E Debt service as percentageof GNP r- as percentage of exports of goods and servicesTable 14. Flow of External Capital 136Gross inflow of public and publicly guaranteed medium- and long-term loansR Repayment of principal E Net inflow of public and publicly guaranteedmedium- and long-term loans E7 Net direct private investmentTable 15. External Public Debt and International Reserves 138External public debt outstanding and disbursed [1 as percentage of GNPn Gross international reserves El in months of import coverageTable 16. Official Development Assistancefrom OECD and OPEC Members 140Amount in dollars E as percentage of donor GNP El in national currenciesEl Net bilateral flow to low-income countriesTable 17. Population Growth, Past and Projected,and Hypothetical Stationary Population 142Past growth of population Fl Projected population E1 Hypothetical size ofstationary population El Assumed year of reaching net reproduction rate of IE Year of reaching stationary populationTable 18. Demographic and Fertility-related Indicators 144Crude birth rate fl Crude death rate E Total fertility rate fl Percentageof women in reproductive age group R Percentage of marriedwomen using contraceptivesTable 19. Labor Force 146Population of working age n Labor force in agriculture E2 in industryE in services n Growth of labor force, past and projectedTable 20. Urbanization 148Urban population as percentage of total population - Growth ofurban population n Percentage in largest city El in cities of over500,000 persons S Number of cities of over 500,000 personsTable 21. Indicators Related to Life Expectancy 150Life expectancy r- Infant mortality rate El Child death rateTable :22. Health-related Indicators 152Population per physician S per nursing person c- Percentage ofpopulation with access to safe water S Daily calorie supply per capitaTable.23. Education 154Number enrolled in primary school as percentage of age groupS in secondary school S7 in higher education S Adult literacyTable 24. Income Distribution 156Percentage share of household income, by percentilegroups of householdsTechnical Notes 158Bibliography of Data Sources 166107


