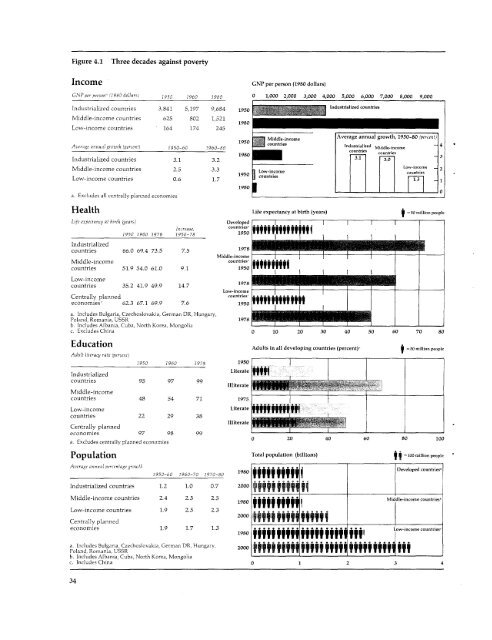
Figure 4.1Three decades against povertyIncomeGNP per person (1980 dollars)GNP per person'(7l980dollars, 1950 1960 1980 0 1,000 2,000 3,000 4,000 5,000 6,000 7,000 8,000 9,000Industrialized countries 3,841 5,197 9,684 1950 IndustrializedcountriesMiddle-income countries 625 802 1,521 1980Low-income countries 164 174 2451950 Middl-i.corne Average annual growth, 1950-80 (percent)Average annual groth (percent) 1950-60 1960-80 T950 Ind-&i.1i.ed Middi-o- 419801980 sountr~~~~~~-mies -- utriesIndustrialized countries 3.1 3.2 3.1Middle-income countries 2.5 3.3 o Low-ioco,e 21950 owmoe,onriesc..Low-income countries 0.6 1.7 1 countriesa. Excludes all centrally planned economiesHealth1980Life expectancy at birth (years)Life expectanrat birth (years) Developed I lIncrease, cou.trieVs ii ii ii1950 1960 1978 1950- 78 15Industrializedcountries 66.0 69.4 73.5 7.5 1978Middle-incomeMiddle-incomecountries'countries 51.9 54.0 61.0 9.1 1950 TYTY ITYTTULow-incomecountries 35.2 41.9 49.9 14.7 1978 _Low-incomeCentrally plannedcountrieseconomies' 62.3 67.1 69.9 7.6 1950 11 11 JIl1j =so million peoplea. Includes Bulgaria, Czechoslovakia, German DR, Hungary,Poland, Romania, USSR 1978b. Includes Albania, Cuba, North Korea, Mongoliac. Excludes China 0 10 20 30 40 50 60 70 80EducationAdults in all developing countries (percent)'Adult literacy rate IperceniO1950 1960 1975 1950IndustrializedLiterate fll9countries 95 97 99 Illiterate9 =so million peopleMiddle-incomecountries 48 54 71 1975Low-income Literate 9ff99$9:9f Icountries 22 29 38IlliterateCentrally plannedeconomies 97 98 99a. Excludes centrally planned economies 0 20 40 60 80 100Population Total population (billions) = 100 million peopleAverage annual percentage growth 198 . . . .. Developed countries1950-60 1960-70 1970-80 1980Industrialized countries 1.2 1.0 0.7 2000 vMiddle-income countries 2.4 2.5 2.5 1980 . .jj; .... Middle-income countries'Low-income countries 1.9 2.5 2.3 01. ., . . . . .Centrally planned 2000 ll'' I Ieconomies 1.9 1.7 1.3 1980 *. . .. . i.. iiii i Low-income countries'o11198 f999999999 9991a. Includes Bulgaria, Czechoslovakia, German DR, Hungary, 2000 ENU EK MN#EE EK E ...Poland, Romania, USSR 2000 | j 1 111ii ifii ii TIb. Includes Albania, Cuba, North Korea, Mongoliac. Includes China 0 1 2 3 434
expectancy was less than 50 years, income countries the incomes of them has widened, even in pro-400 million in countries where the the poor have grown more slowly portional terms (though in the caseaverage annual death rate of chil- than the average. The proportion of the middle-income countriesdren aged one to four was more of people in absolute poverty in only slightly). But the gaps in eduthan20 per 1,000-20 times that developing countries as a group cation and health have narrowedin the industrialized countries. is estimated to have fallen during -by 15 percentage points in adultNor is there any serious dis- the past two decades (though literacy and five years in lifeagreementaboutwhothepoorare. probably not in Sub-Saharan expectancy.Half of the people in absolute Africa in the 1970s-see Chapterpoverty live in South Asia, mainly 2). But because population has Poverty and growthin India and Bangladesh. A sixth grown, the number of people inlive in East and Southeast Asia, absolute poverty has increased. Most poor people live in poormainly in Indonesia. Another sixth There has also been progress countries. Whether absolute povarein Sub-Saharan Africa. The in education. The proportion of erty is measured by low income,rest-about 100 million people- adults in developing countries who low life expectancy or illiteracy,are divided among Latin America, are literate is estimated to have there is a strong correlation betweenNorth Africa and the Middle East. increased over the past three the extent of poverty in a countryWith thie partial exception of Latin decades from about 30 percent to and its GNP per person (see Fig-America (where about 40 percent more than 50 percent; the propor- ure 4.2 overleaf). This suggestsare in the towns) the poor are tion of children of primary-school that the solution to poverty is ecoprimaiilyrural dwellers, over- age enrolled in school rose from 47 nomic growth. There is a great dealwhelm:ingly dependent on agri- percent in 1960 to 64 percent in of truth in this proposition, butculture-the majority of them 1977. These advances have been it needs to be carefully qualified.landless (or nearly landless) labor- shared by most countries and re- First, comparing countries, theers. Some minority groups-for gions, including those that initially relation beween the extent of theirexample, the Indians in Latin were furthest behind, such as absolute poverty and the level ofAmerica and the scheduled castes Sub-Saharan Africa. But the qual- GNP per person is (as the disperinIndia-are also overrepresented ity of schooling remains low in sion of points in Figure 4.2 shows)among the poor. And there is a many countries; and because of far from perfect. Because oftendency for absolute poverty in population growth, there has been differences in income distribution,particular places, families and an increase of about 100 million the proportion of the populationsocial groups to persist from gen- in the absolute number of illiterate below the poverty line in 1975 waseration to generation. adults since 1950. more than twice as high in Colom-The most striking advances bia as in South Korea, even thoughThree decades of poverty against poverty have been in the average incomes of the tworeduction health. Average life expectancy inmiddle-income developing councountrieswere close. Sri Lanka isa low-income country, yet the lifeIn aggregate, however, consider- tries has risen nine years over the expectancy of its people approachesable progress has been made in past three decades. In low-income that of the industrialized countries.reducing the incidence of poverty countries, the increase has been Some middle-income countries,over the past 30 years (see Figure even greater-15 years. But even such as Morocco and the Ivory4.1). Progress would have been though infant mortality rates Coast, have literacy rates belowgreater still but for the dramatic (which are a major determinant of those of the average low-incomegrowth of population, which has life expectancy) have fallen sub- country.doubled the number of people in stantially in developing countries Second, looking at changes overthe developing world since 1950 since 1950, there now are so many time within particular countries,and has begun to slow down- more children born that the abso- the connection between growththough as yet slightly-only since lute number of infant deaths and poverty reduction over periodsthe mid-1960s. probably has not declined. of a decade or two appears inexact.Since 1950 income per person Another way of viewing the There is general agreement thatin the developing world has doubled. progress of the past three decades growth, in the very long term,But in low-income countries, the is to compare the developing with eliminates most absolute poverty;average increase has been half the industrialized countries. The but also that some people maythat, and in both low- and middle- gap in income per person between (at least temporarily) be impover-35
- Page 1: t' 8 ~~~~ottoWorld Development Repo
- Page 4 and 5: Oc 1980 by the International Bankfo
- Page 6 and 7: ivThis report was prepared by a tea
- Page 8 and 9: Text tables2.1 Summary of prospects
- Page 10 and 11: DefinitionsCountry groups in the an
- Page 12 and 13: illion people have barely enough fa
- Page 14: in official aid and other capital a
- Page 17 and 18: production and consumption; in- Tab
- Page 19 and 20: measures can raise efficiency fairl
- Page 21 and 22: adjustment; but the increases pro-
- Page 23 and 24: dustrialized countries' GNP would T
- Page 25 and 26: windfalls, some of their extra cont
- Page 27 and 28: e done to increase the supplies Lat
- Page 29 and 30: exchange-rate depreciation, by perc
- Page 31 and 32: Table 3.2 World merchandise trade,
- Page 33 and 34: * Inward-looking policies may exper
- Page 35 and 36: inward-looking policies, with high
- Page 37 and 38: cause individual banks or bank- Tab
- Page 39 and 40: to GNP, of all large industrial na-
- Page 41 and 42: in Chapter 2). Ways of increasing a
- Page 43: 4 Poverty, growth and human develop
- Page 47 and 48: population density (see page 39). e
- Page 49 and 50: ably could not have been achieved c
- Page 51 and 52: ution of income typically is less T
- Page 53 and 54: Table 4.2 Irrigation and income, se
- Page 55 and 56: ment strategies that assume that in
- Page 57 and 58: average 40 percent drop out before
- Page 59 and 60: this may be offset by shifts in the
- Page 61 and 62: UNESCO concluded that the poorUnemp
- Page 63 and 64: A typical finding showed the mean o
- Page 65 and 66: Table5.6 Differences in life tend t
- Page 67 and 68: are more expensive and less critica
- Page 69 and 70: per hos pital and clinic, and to st
- Page 71 and 72: peaks in farm work and widespreadin
- Page 73 and 74: confined to particular places. In A
- Page 75 and 76: Indonesia, Colombia and Chilehave r
- Page 77 and 78: (which respond only gradually to cu
- Page 79 and 80: Contraceptive technologyresearch in
- Page 81 and 82: 6 Implementing human development pr
- Page 83 and 84: probably China-have managed Table 6
- Page 85 and 86: percent of the development bud- dev
- Page 87 and 88: members, too, as no bureaucraticRur
- Page 89 and 90: Private costs of using public servi
- Page 91 and 92: ut not teachers or health workers,
- Page 93 and 94: 7 Priorities and progress in region
- Page 95 and 96:
literacy and life expectancy); andF
- Page 97 and 98:
to establish the necessary admin-Fi
- Page 99 and 100:
Poverty Figure 7.5 South Asia: life
- Page 101 and 102:
and North Africa cover the spec- gr
- Page 103 and 104:
The high level of urbanization well
- Page 105 and 106:
Chaipter 8 Summary and conclusionsI
- Page 107 and 108:
is high, frequently well above that
- Page 109 and 110:
Stat.istical appendix to Part ITabl
- Page 111 and 112:
Table SA.6 Capital flows and debt o
- Page 113 and 114:
Montgomery survey administra- publi
- Page 115 and 116:
AnnexWorldDevelopmentIndicators
- Page 117 and 118:
Table 13. Balance of Payments and D
- Page 119 and 120:
IntroductionThe World Development I
- Page 121 and 122:
GNP per capitaAverage indexAverageo
- Page 123 and 124:
Average annual growth rate (percent
- Page 125 and 126:
Distribution of gross domestic prod
- Page 127 and 128:
Average annual growth rate (percent
- Page 129 and 130:
Distribution of gross domestic prod
- Page 131 and 132:
Distribution of value added (percen
- Page 133 and 134:
EnergyEnergyconsumptionAverage annu
- Page 135 and 136:
Merchandise tradeAverage annual gro
- Page 137 and 138:
Percentage share of merchandise exp
- Page 139 and 140:
Percentage share of merchandise imp
- Page 141 and 142:
Destination of merchandise exports
- Page 143 and 144:
Destination of manufactured exports
- Page 145 and 146:
Current accountbalance before Inter
- Page 147 and 148:
Public and publicly guaranteed medi
- Page 149 and 150:
External public debtoutstanding and
- Page 151 and 152:
Amount1981a 1982a 1983a 1984a 1985a
- Page 153 and 154:
Average annualHypotheticalgrowth of
- Page 155 and 156:
PercentageCrude Crude Percentage Pe
- Page 157 and 158:
Percentage ofpopulation ofworking a
- Page 159 and 160:
Percentage of urban population Numb
- Page 161 and 162:
Life Infant Childexpectancy mortali
- Page 163 and 164:
PercentageDaily calorie supplyPopul
- Page 165 and 166:
Number Numberenrolled in enrolled i
- Page 167 and 168:
Percentage share of household incom
- Page 169 and 170:
Average index Tables 4 and 5. Growt
- Page 171 and 172:
28 (minerals, crude fertilizers and
- Page 173 and 174:
continues to grow after replacement
- Page 175 and 176:
posttax income and conceptually tic
- Page 180:
-~~~ S-~~~~~ sEuropean Office:66, a