fly on to bite the rich as well. InBrazil in 1974, an epidemic of spinal How much would it cost?meningitis aroused public concern- Take an illustrative list of human develop- cost 4 percent of GNP. Eliminating foodin response, 80 million people were ment needs: five years at school; adequate deficits in Brazil-with its much highervaccinated within 10 months, nutrition; primary health care no more income-could cost from I to 2 percentstopping the epidemic. than an hour away; family planningservices; at least 20 liters a day of pureof GNP in 1980, depending on the typeof food provided.are also seen almost everywherewater within 100 yards of home; and apit latrine. How much would it cost a* Health and family planning. Malay-sia's system of public health care coveredas contributing to national unity. government in a developing country to more than 75 percent of the populationUniversal primary education in provide this for everyone? in 1974. It relied heavily on low-costparticular can provide all citizens The answer varies from country to paramedical staff-and its operating costswith a common intellectual heritage country, depending first (and most were nearly 2percent of GNP. Sri Lanka'simportantly) on the standard of service; government spent about 1.7 percent inand help overcome the potentially second on such factors as climate, the mid-1970s. China's central governdivisiveeffects of regionalism, communications and population disper- ment spent less than 1 percent on healthtribalism, race and caste and class sion; and third on the balance between in 1978, but much of the primary caredistinctions. In addition, govern- capital and operating costs (most budgets system was financed locally; Brazil' spentments often see human development do not provide enough for the operating about 2.5 percent of GNP in 1975, butcosts that an effective service would public health insurance was biased towardas helping to build broad-based need). But there are also two general hospitals and urban areas-covering almostpolitical support among potentially rules that affect cost: one, for any given go percent of urIan dwellers but muchantagonistic groups. standard the proportion of GNP required less of the 40 percent of people in ruralThe appeal of and political com- falls as GNP rises, partly because higher- areas.income countries have more educated * Water. A recent <strong>World</strong> <strong>Bank</strong> estimatecut across ideological boundaries:people-whose wages are therefore relativelylower-to implement the programs,suggests that it would cost the Tanzaniangovernment about 1.8 percent of GNPChina, Cuba and North Korea have and partly because nonlabor costs rise a year over a 10-year period to supplyplaced great emphasis on such more slowly than GNP. And two, mar- every village with pure and reliable water,programs, but so have South Korea ginal unit costs usually fall as coverage plus 0.8 percent for operating costs onceand Costa Rica. Their appeal is rises, but only up to a point: the costs of the system is fully established. In Braziland Costa Rica. reaching the last 10-20 percent of the theinvestmentneededtocoverthewholereinforced by international and population may be several times the population by 2000 has been estimatedethical support. The Universal average costs for the first 80-90 percent at less than 0.1 percent a year of a muchDeclaration of Human Rights of because of physical inaccessibility or larger and faster-growing GNP in rural1948 included the rights to food, inadequate demand. areas (allowing for higher costs to reachhealth and education. The United Some examples from different countries: the last 10 percent of the rural population)h Education. The average gross enroll- and perhaps 0.1 to 0.2 percent a year inNations and its specialized agencies mentratiofor primary school in developing urban areas depending on GNP growth.have played an important role in countries in the early 1970s was about Coverage of the rural and urban populafocusinginternational attention 70 percent; central governments were tions was 62 and 14 percent, respectively,on human development and on then spending an average of 1.7 percent in 1976. Operating costs are borne bypopulation issues. All the major of GNP on primary education. Few the users.governments have provided universal * Sanitation. In Brazil, where 37 percentreligions also provide strong back- elementary education for less than 3 of urban houses had sewers or septicing for efforts to improve the health, percent of GNP. Peninsular Malaysia tanks in 1976, extending the sewer networknutrition and education of the poor. spent 2.7 percent in the mid-1970s and to cover them all by 2000 would requirehad a gross enrollment rate of 93 percent. annual investments of about 0.2 to 0.3Easing the financial constraint* Nutrition. In 1979, when subsidized percent of GNP. Providing latrines inrations were restricted to the poorer half rural areas would cost only between 0.01Finance ministers everywhere (withof the population in Sri Lanka, they still and 0.02 percent of GNP.the exception of some mineral-richcountries) find that available fundscannot meet the many competing ture, debt service, defense and so of GNP (and often a good dealdemands placed on them. In the on) commonly exceed 12 percent more) on doing so.poorer countries, public revenue of GNP. Yet governments that have The costs involved depend on(taxes, other domestic revenue and assuredvirtuallyeveryoneprimary many factors (see box), among theforeign assistance) usually is less education, health care, family most important of which are thethan 20 percent of GNP, while planning services, adequate food, range and standard of services.expenditures other than on social pure water and sanitation have Thus governments in some poorprograms (agriculture, infrastruc- generally spent more than 10 percent countries-notably Sri Lanka and72
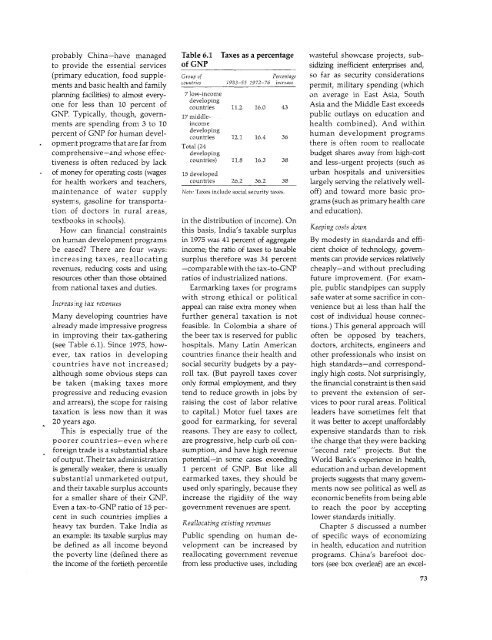
probably China-have managed Table 6.1 Taxes as a percentage wasteful showcase projects, subtoprovide the essential services of GNP sidizing inefficient enterprises and,(primary education, food supple- Group of Percentage so far as security considerationsments and basic health and family countries 1953-551972-76 increase permit, military spending (whichplannirng facilities) to almost every- 7 low-income on average in East Asia, Southone for less than 10 percent of countries 11.2 16.0 43 Asia and the Middle East exceedsGNP. Typically, though, govern- 17 middle- public outlays on education andments are spending from 3 to 10 income health combined). And withinpercent of GNP for human devel- developing human development programspercent~~~~~~~~~countries12.1 16.4 36 thuman developenromto prelogramsopment programs that are far from Total (24 there is often room to reallocatecomprehensive-and whose effec- developing budget shares away from high-costtiveness is often reduced by lack countries) 11.8 16.3 38 and less-urgent projects (such asof money for operating costs (wages 15 developed urban hospitals and universitiesfor health workers and teachers, countries 26.2 36.2 38 largely serving the relatively wellmaintenanceof water supply Note: Taxes include social security taxes. off) and toward more basic prosysterms,gasoline for transporta- grams (such as primary health caretion of doctors in rural areas, and education).textbooks in schools). in the distribution of income). OnHow can financial constraints this basis, India's taxable surplus Keeping costs downon hurnan development programs in 1975 was 41 percent of aggregate By modesty in standards and effibeeased? There are four ways: income; the ratio of taxes to taxable cient choice of technology, govemincreasingtaxes, reallocating surplus therefore was 34 percent ments can provide services relativelyrevenues, reducing costs and using -comparable with the tax-to-GNP cheaply-and without precludingresources other than those obtained ratios of industrialized nations. future improvement. (For examfromnational taxes and duties. Earmarking taxes for programs ple, public standpipes can supplywith strong ethical or political safe water at some sacrifice in con-Increas.;ng tax revenues appeal can raise extra money when venience but at less than half theMany developing countries have further general taxation is not cost of individual house connecalreadymade impressive progress feasible. In Colombia a share of tions.) This general approach willin improving their tax-gathering the beer tax is reserved for public often be opposed by teachers,(see Table 6.1). Since 1975, how- hospitals. Many Latin American doctors, architects, engineers andever, tax ratios in developing countries finance their health and other professionals who insist oncountries have not increased; social security budgets by a pay- high standards-and correspondalthoughsome obvious steps can roll tax. (But payroll taxes cover ingly high costs. Not surprisingly,be taken (making taxes more only formal employment, and they the financial constraint is then saidprogressive and reducing evasion tend to reduce growth in jobs by to prevent the extension of serandarrears), the scope for raising raising the cost of labor relative vices to poor rural areas. Politicaltaxation is less now than it was to capital.) Motor fuel taxes are leaders have sometimes felt that20 years ago. good for earmarking, for several it was better to accept unaffordablyThis is especially true of the reasons. They are easy to collect, expensive standards than to riskpoorer countries-even where are progressive, help curb oil con- the charge that they were backingforeign trade is a substantial share sumption, and have high revenue "second rate" projects. But theof output. Their tax administration potential-in some cases exceeding <strong>World</strong> <strong>Bank</strong>'s experience in health,is generally weaker, there is usually 1 percent of GNP. But like all education and urban developmentsubstantial unmarketed output, earmarked taxes, they should be projects suggests that many govemandtheir taxable surplus accounts used only sparingly, because they ments now see political as well asfor a smaller share of their GNP. increase the rigidity of the way economic benefits from being ableEven a tax-to-GNP ratio of 15 per- government revenues are spent. to reach the poor by acceptingcent in such countries implies a lower standards initially.heavy tax burden. Take India as Reallocating existing revenues Chapter 5 discussed a numberan example: its taxable surplus may Public spending on human de- of specific ways of economizingbe defined as all income beyond velopment can be increased by in health, education and nutritionthe poverty line (defined there as reallocating government revenue programs. China's barefoot doctheincome of the fortieth percentile from less productive uses, including tors (see box overleaf) are an excel-73
- Page 1:
t' 8 ~~~~ottoWorld Development Repo
- Page 4 and 5:
Oc 1980 by the International Bankfo
- Page 6 and 7:
ivThis report was prepared by a tea
- Page 8 and 9:
Text tables2.1 Summary of prospects
- Page 10 and 11:
DefinitionsCountry groups in the an
- Page 12 and 13:
illion people have barely enough fa
- Page 14:
in official aid and other capital a
- Page 17 and 18:
production and consumption; in- Tab
- Page 19 and 20:
measures can raise efficiency fairl
- Page 21 and 22:
adjustment; but the increases pro-
- Page 23 and 24:
dustrialized countries' GNP would T
- Page 25 and 26:
windfalls, some of their extra cont
- Page 27 and 28:
e done to increase the supplies Lat
- Page 29 and 30:
exchange-rate depreciation, by perc
- Page 31 and 32: Table 3.2 World merchandise trade,
- Page 33 and 34: * Inward-looking policies may exper
- Page 35 and 36: inward-looking policies, with high
- Page 37 and 38: cause individual banks or bank- Tab
- Page 39 and 40: to GNP, of all large industrial na-
- Page 41 and 42: in Chapter 2). Ways of increasing a
- Page 43 and 44: 4 Poverty, growth and human develop
- Page 45 and 46: expectancy was less than 50 years,
- Page 47 and 48: population density (see page 39). e
- Page 49 and 50: ably could not have been achieved c
- Page 51 and 52: ution of income typically is less T
- Page 53 and 54: Table 4.2 Irrigation and income, se
- Page 55 and 56: ment strategies that assume that in
- Page 57 and 58: average 40 percent drop out before
- Page 59 and 60: this may be offset by shifts in the
- Page 61 and 62: UNESCO concluded that the poorUnemp
- Page 63 and 64: A typical finding showed the mean o
- Page 65 and 66: Table5.6 Differences in life tend t
- Page 67 and 68: are more expensive and less critica
- Page 69 and 70: per hos pital and clinic, and to st
- Page 71 and 72: peaks in farm work and widespreadin
- Page 73 and 74: confined to particular places. In A
- Page 75 and 76: Indonesia, Colombia and Chilehave r
- Page 77 and 78: (which respond only gradually to cu
- Page 79 and 80: Contraceptive technologyresearch in
- Page 81: 6 Implementing human development pr
- Page 85 and 86: percent of the development bud- dev
- Page 87 and 88: members, too, as no bureaucraticRur
- Page 89 and 90: Private costs of using public servi
- Page 91 and 92: ut not teachers or health workers,
- Page 93 and 94: 7 Priorities and progress in region
- Page 95 and 96: literacy and life expectancy); andF
- Page 97 and 98: to establish the necessary admin-Fi
- Page 99 and 100: Poverty Figure 7.5 South Asia: life
- Page 101 and 102: and North Africa cover the spec- gr
- Page 103 and 104: The high level of urbanization well
- Page 105 and 106: Chaipter 8 Summary and conclusionsI
- Page 107 and 108: is high, frequently well above that
- Page 109 and 110: Stat.istical appendix to Part ITabl
- Page 111 and 112: Table SA.6 Capital flows and debt o
- Page 113 and 114: Montgomery survey administra- publi
- Page 115 and 116: AnnexWorldDevelopmentIndicators
- Page 117 and 118: Table 13. Balance of Payments and D
- Page 119 and 120: IntroductionThe World Development I
- Page 121 and 122: GNP per capitaAverage indexAverageo
- Page 123 and 124: Average annual growth rate (percent
- Page 125 and 126: Distribution of gross domestic prod
- Page 127 and 128: Average annual growth rate (percent
- Page 129 and 130: Distribution of gross domestic prod
- Page 131 and 132: Distribution of value added (percen
- Page 133 and 134:
EnergyEnergyconsumptionAverage annu
- Page 135 and 136:
Merchandise tradeAverage annual gro
- Page 137 and 138:
Percentage share of merchandise exp
- Page 139 and 140:
Percentage share of merchandise imp
- Page 141 and 142:
Destination of merchandise exports
- Page 143 and 144:
Destination of manufactured exports
- Page 145 and 146:
Current accountbalance before Inter
- Page 147 and 148:
Public and publicly guaranteed medi
- Page 149 and 150:
External public debtoutstanding and
- Page 151 and 152:
Amount1981a 1982a 1983a 1984a 1985a
- Page 153 and 154:
Average annualHypotheticalgrowth of
- Page 155 and 156:
PercentageCrude Crude Percentage Pe
- Page 157 and 158:
Percentage ofpopulation ofworking a
- Page 159 and 160:
Percentage of urban population Numb
- Page 161 and 162:
Life Infant Childexpectancy mortali
- Page 163 and 164:
PercentageDaily calorie supplyPopul
- Page 165 and 166:
Number Numberenrolled in enrolled i
- Page 167 and 168:
Percentage share of household incom
- Page 169 and 170:
Average index Tables 4 and 5. Growt
- Page 171 and 172:
28 (minerals, crude fertilizers and
- Page 173 and 174:
continues to grow after replacement
- Page 175 and 176:
posttax income and conceptually tic
- Page 180:
-~~~ S-~~~~~ sEuropean Office:66, a