- Page 1 and 2: ReGIstRAtIonDoCUMent& FInAnCIALAnnU
- Page 3 and 4: ContentsPage1 Person responsible fo
- Page 5 and 6: 1PeRsonResPonsIBLe FoRtHe ReGIstRAt
- Page 8 and 9: 3seLeCteDFInAnCIALInFoRMAtIon3.1. o
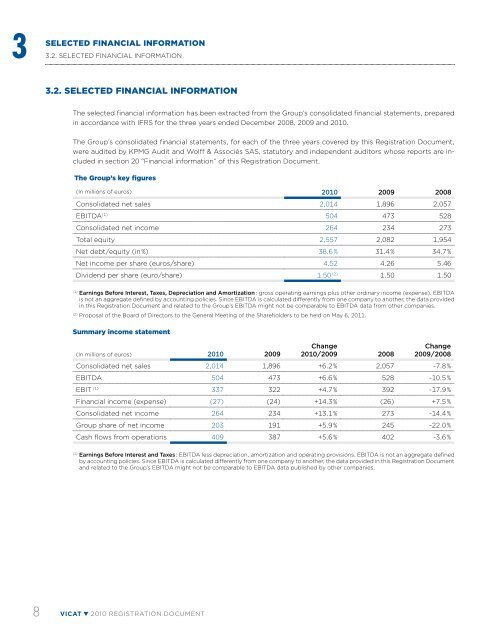
- Page 12 and 13: 3SELECTED FINANCIAL INFORMATION3.2.
- Page 14 and 15: 4RIsK FACtoRs4.1. risks relating to
- Page 16 and 17: 4RISK FACTORS4.1. Risks relating to
- Page 18: 4RISK FACTORS4.3. Legal riskswhich
- Page 21 and 22: 4RISK FACTORS4.5. Risks related to
- Page 23 and 24: 5InFoRMAtIonABoUttHe CoMPAnY5.1. Hi
- Page 25 and 26: INFORMATION ABOUT THE COMPANY5.2. I
- Page 27 and 28: INFORMATION ABOUT THE COMPANY5.2. I
- Page 29 and 30: 6BUsInessoVeRVIeW6.1. overview of t
- Page 31 and 32: 6BUSINESS OVERVIEW6.2. Group streng
- Page 33 and 34: 6BUSINESS OVERVIEW6.2. Group streng
- Page 35 and 36: 6BUSINESS OVERVIEW6.3. Description
- Page 37 and 38: 6BUSINESS OVERVIEW6.3. Description
- Page 39 and 40: 6BUSINESS OVERVIEW6.3. Description
- Page 41 and 42: 6BUSINESS OVERVIEW6.3. Description
- Page 43 and 44: 6BUSINESS OVERVIEW6.3. Description
- Page 45 and 46: 6BUSINESS OVERVIEW6.3. Description
- Page 47 and 48: 6BUSINESS OVERVIEW6.3. Description
- Page 49 and 50: 6BUSINESS OVERVIEW6.3. Description
- Page 51 and 52: 6BUSINESS OVERVIEW6.3. Description
- Page 53 and 54: 6BUSINESS OVERVIEW6.3. Description
- Page 55 and 56: 6BUSINESS OVERVIEW6.3. Description
- Page 57 and 58: 6BUSINESS OVERVIEW6.3. Description
- Page 59 and 60: 7oRGAnIsAtIonCHARt7.1. Simplified l
- Page 61 and 62:
7ORGANISATION CHART7.2. Information
- Page 63 and 64:
7ORGANISATION CHART7.2. Information
- Page 65 and 66:
REAL ESTATE, FACTORIES AND EQUIPMEN
- Page 67 and 68:
REAL ESTATE, FACTORIES AND EQUIPMEN
- Page 69 and 70:
REAL ESTATE, FACTORIES AND EQUIPMEN
- Page 71 and 72:
9eXAMInAtIonoF tHe FInAnCIALPosItIo
- Page 73 and 74:
EXAMINATION OF THE FINANCIAL POSITI
- Page 75 and 76:
EXAMINATION OF THE FINANCIAL POSITI
- Page 77 and 78:
EXAMINATION OF THE FINANCIAL POSITI
- Page 79 and 80:
EXAMINATION OF THE FINANCIAL POSITI
- Page 81 and 82:
EXAMINATION OF THE FINANCIAL POSITI
- Page 83 and 84:
10CAsH FLoWAnD eQUItY10.1. EQuItY 8
- Page 85 and 86:
Cash flow and equity10.2. Cash flow
- Page 87 and 88:
Cash flow and equity10.3. INDEBTEDN
- Page 89 and 90:
Cash flow and equity10.3. INDEBTEDN
- Page 91 and 92:
10Cash flow and equity10.4. ANALYSI
- Page 93 and 94:
RESEARCH AND DEVELOPMENT, PATENTS A
- Page 95 and 96:
Information on trends12.2. Trends a
- Page 97 and 98:
13PRoFIt FoReCAstsoR estIMAtesThe C
- Page 99 and 100:
14ADMINISTRATION AND GENERAL MANAGE
- Page 101 and 102:
14ADMINISTRATION AND GENERAL MANAGE
- Page 103 and 104:
ADMINISTRATION AND GENERAL MANAGEME
- Page 105 and 106:
15ReMUneRAtIonAnD BeneFIts15.1. rem
- Page 107 and 108:
15REMUNERATION AND BENEFITS15.2. Pe
- Page 109 and 110:
16oPeRAtIon oFtHe ADMInIstRAtIVeAnD
- Page 111 and 112:
OPERATION OF THE ADMINISTRATIVE AND
- Page 113 and 114:
OPERATION OF THE ADMINISTRATIVE AND
- Page 115 and 116:
17EMPLOYEES17.1. Overview17.1.1. Br
- Page 117 and 118:
17EMPLOYEES17.1. OverviewHuman Reso
- Page 119 and 120:
EMPLOYEES17.4. Shareholding of the
- Page 121 and 122:
18PRInCIPALsHAReHoLDeRs18.1. distri
- Page 123 and 124:
19oPeRAtIonsWItH ReLAteD19.1. contr
- Page 125 and 126:
19OPeRATIONS with related19.3. Stat
- Page 127 and 128:
Financial information on the assets
- Page 129 and 130:
Financial information on the assets
- Page 131 and 132:
Financial information on the assets
- Page 133 and 134:
Financial information on the assets
- Page 135 and 136:
Financial information on the assets
- Page 137 and 138:
Financial information on the assets
- Page 139 and 140:
Financial information on the assets
- Page 141 and 142:
Financial information on the assets
- Page 143 and 144:
Financial information on the assets
- Page 145 and 146:
Financial information on the assets
- Page 147 and 148:
Financial information on the assets
- Page 149 and 150:
Financial information on the assets
- Page 151 and 152:
Financial information on the assets
- Page 153 and 154:
Financial information on the assets
- Page 155 and 156:
Financial information on the assets
- Page 157 and 158:
Financial information on the assets
- Page 159 and 160:
Financial information on the assets
- Page 161 and 162:
Financial information on the assets
- Page 163 and 164:
Financial information on the assets
- Page 165 and 166:
Financial information on the assets
- Page 167 and 168:
Financial information on the assets
- Page 169 and 170:
Financial information on the assets
- Page 171 and 172:
Financial information on the assets
- Page 173 and 174:
Financial information on the assets
- Page 175 and 176:
Financial information on the assets
- Page 177 and 178:
Financial information on the assets
- Page 179:
Financial information on the assets
- Page 182 and 183:
information on the assets and liabi
- Page 184 and 185:
information on the assets and liabi
- Page 186 and 187:
information on the assets and liabi
- Page 188 and 189:
20information on the assets and lia
- Page 190 and 191:
21ADDITIONAL INFORMATION21.1. Share
- Page 192 and 193:
21 21.2.ADDITIONAL INFORMATIONConst
- Page 194 and 195:
21ADDITIONAL INFORMATION21.2. Const
- Page 196 and 197:
21ADDITIONAL INFORMATION21.2. Const
- Page 198 and 199:
22sIGnIFICAntContRACtsGiven its act
- Page 200 and 201:
24DoCUMentsAVAILABLeto tHe PUBLICOf
- Page 202 and 203:
APPenDIX1report by the president on
- Page 204 and 205:
1APPENDIXReport by the president on
- Page 206 and 207:
1APPENDIXReport by the president on
- Page 208 and 209:
1APPENDIXReport by the president on
- Page 210 and 211:
1APPENDIXReport by the president on
- Page 212 and 213:
2appendixStatutory auditors’ repo
- Page 214 and 215:
3APPENDIXAnnual information1. Refer
- Page 216 and 217:
APPenDIX4eLeMentsConstItUtInGtHe FI
- Page 218 and 219:
GLossARY216 VICAT 2010 registration
- Page 220 and 221:
GLOSSARyCarbonationCEMCEM I(formerl
- Page 222 and 223:
GLOSSARyElectrostatic filterExhaust
- Page 224 and 225:
GLOSSARyMixerApparatus used to mix
- Page 226:
GLOSSARySilica fumeSiloSlagStandard