1 Background - mountain.PROJECTS
1 Background - mountain.PROJECTS
1 Background - mountain.PROJECTS

You also want an ePaper? Increase the reach of your titles
YUMPU automatically turns print PDFs into web optimized ePapers that Google loves.
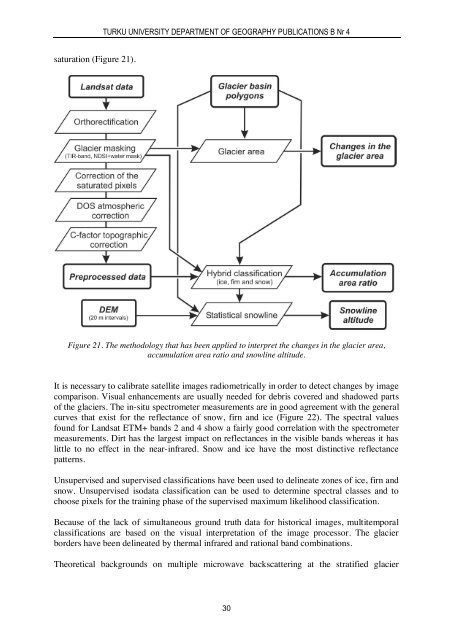
TURKU UNIVERSITY DEPARTMENT OF GEOGRAPHY PUBLICATIONS B Nr 4saturation (Figure 21).Figure 21. The methodology that has been applied to interpret the changes in the glacier area,accumulation area ratio and snowline altitude.It is necessary to calibrate satellite images radiometrically in order to detect changes by imagecomparison. Visual enhancements are usually needed for debris covered and shadowed partsof the glaciers. The in-situ spectrometer measurements are in good agreement with the generalcurves that exist for the reflectance of snow, firn and ice (Figure 22). The spectral valuesfound for Landsat ETM+ bands 2 and 4 show a fairly good correlation with the spectrometermeasurements. Dirt has the largest impact on reflectances in the visible bands whereas it haslittle to no effect in the near-infrared. Snow and ice have the most distinctive reflectancepatterns.Unsupervised and supervised classifications have been used to delineate zones of ice, firn andsnow. Unsupervised isodata classification can be used to determine spectral classes and tochoose pixels for the training phase of the supervised maximum likelihood classification.Because of the lack of simultaneous ground truth data for historical images, multitemporalclassifications are based on the visual interpretation of the image processor. The glacierborders have been delineated by thermal infrared and rational band combinations.Theoretical backgrounds on multiple microwave backscattering at the stratified glacier30