1 Background - mountain.PROJECTS
1 Background - mountain.PROJECTS
1 Background - mountain.PROJECTS

Create successful ePaper yourself
Turn your PDF publications into a flip-book with our unique Google optimized e-Paper software.
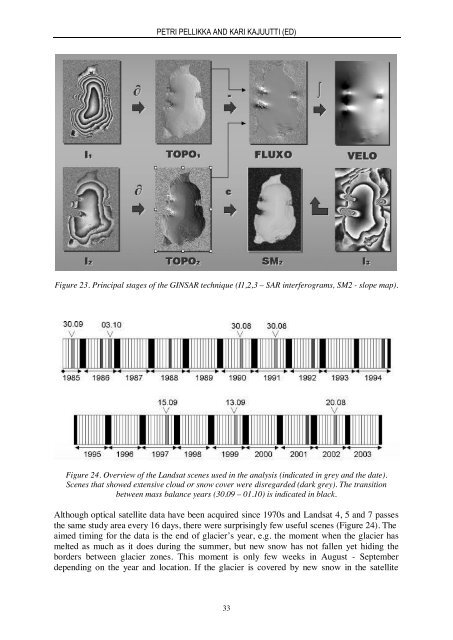
PETRI PELLIKKA AND KARI KAJUUTTI (ED)Figure 23. Principal stages of the GINSAR technique (I1,2,3 – SAR interferograms, SM2 - slope map).Figure 24. Overview of the Landsat scenes used in the analysis (indicated in grey and the date).Scenes that showed extensive cloud or snow cover were disregarded (dark grey). The transitionbetween mass balance years (30.09 – 01.10) is indicated in black.Although optical satellite data have been acquired since 1970s and Landsat 4, 5 and 7 passesthe same study area every 16 days, there were surprisingly few useful scenes (Figure 24). Theaimed timing for the data is the end of glacier’s year, e.g. the moment when the glacier hasmelted as much as it does during the summer, but new snow has not fallen yet hiding theborders between glacier zones. This moment is only few weeks in August - Septemberdepending on the year and location. If the glacier is covered by new snow in the satellite33