1 Background - mountain.PROJECTS
1 Background - mountain.PROJECTS
1 Background - mountain.PROJECTS

You also want an ePaper? Increase the reach of your titles
YUMPU automatically turns print PDFs into web optimized ePapers that Google loves.
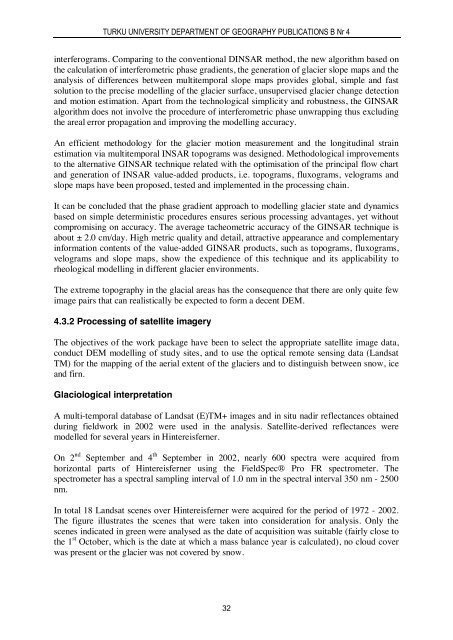
TURKU UNIVERSITY DEPARTMENT OF GEOGRAPHY PUBLICATIONS B Nr 4interferograms. Comparing to the conventional DINSAR method, the new algorithm based onthe calculation of interferometric phase gradients, the generation of glacier slope maps and theanalysis of differences between multitemporal slope maps provides global, simple and fastsolution to the precise modelling of the glacier surface, unsupervised glacier change detectionand motion estimation. Apart from the technological simplicity and robustness, the GINSARalgorithm does not involve the procedure of interferometric phase unwrapping thus excludingthe areal error propagation and improving the modelling accuracy.An efficient methodology for the glacier motion measurement and the longitudinal strainestimation via multitemporal INSAR topograms was designed. Methodological improvementsto the alternative GINSAR technique related with the optimisation of the principal flow chartand generation of INSAR value-added products, i.e. topograms, fluxograms, velograms andslope maps have been proposed, tested and implemented in the processing chain.It can be concluded that the phase gradient approach to modelling glacier state and dynamicsbased on simple deterministic procedures ensures serious processing advantages, yet withoutcompromising on accuracy. The average tacheometric accuracy of the GINSAR technique isabout ± 2.0 cm/day. High metric quality and detail, attractive appearance and complementaryinformation contents of the value-added GINSAR products, such as topograms, fluxograms,velograms and slope maps, show the expedience of this technique and its applicability torheological modelling in different glacier environments.The extreme topography in the glacial areas has the consequence that there are only quite fewimage pairs that can realistically be expected to form a decent DEM.4.3.2 Processing of satellite imageryThe objectives of the work package have been to select the appropriate satellite image data,conduct DEM modelling of study sites, and to use the optical remote sensing data (LandsatTM) for the mapping of the aerial extent of the glaciers and to distinguish between snow, iceand firn.Glaciological interpretationA multi-temporal database of Landsat (E)TM+ images and in situ nadir reflectances obtainedduring fieldwork in 2002 were used in the analysis. Satellite-derived reflectances weremodelled for several years in Hintereisferner.On 2 nd September and 4 th September in 2002, nearly 600 spectra were acquired fromhorizontal parts of Hintereisferner using the FieldSpec® Pro FR spectrometer. Thespectrometer has a spectral sampling interval of 1.0 nm in the spectral interval 350 nm - 2500nm.In total 18 Landsat scenes over Hintereisferner were acquired for the period of 1972 - 2002.The figure illustrates the scenes that were taken into consideration for analysis. Only thescenes indicated in green were analysed as the date of acquisition was suitable (fairly close tothe 1 st October, which is the date at which a mass balance year is calculated), no cloud coverwas present or the glacier was not covered by snow.32