notes to the financial statementsPASSION<strong>ASIAN</strong> <strong>HOTELS</strong> <strong>AND</strong> <strong>PROPERTIES</strong> <strong>PLC</strong>Annual Report <strong>2012</strong> /<strong>13</strong>15436. FINANCIAL RISK MANAGEMENTOBJECTIVES <strong>AND</strong> POLICIESFINANCIAL INSTRUMENTSFinancial instruments held by the Group,principally comprise of cash, loansand other receivables, trade and otherreceivables, trade and other payables, loansand borrowings and finance leases. Themain purpose of these financial instrumentsis to manage the operating, investing andfinancing activities of the Group.Financial risk management of the Group iscarried out based on guidelines establishedby its parent company’s central treasurydepartment (Group Treasury) which comesunder the purview of the Group ExecutiveCommittee (GEC) of the parent company.Group Treasury identifies, evaluates andhedges financial risks in close co-operationwith the Group’s operating units. The parentcompany provides guidelines for overallrisk management, as well, covering specificareas such as credit risk, investment ofexcess liquidity, interest rate risk and foreigncurrency risk.The Group has established guidelines forrisk controlling procedures and for theuse of financial instruments, including aclear segregation of duties with regard tofinancial activities, settlement, accountingand related controlling. The guidelinesupon which the Group’s risk managementprocesses are based are designed toidentify and analyse these risks throughoutthe Group, to set appropriate risk limits andcontrols and to monitor the risks by meansof reliable and up-to-date administrativeand information systems. The guidelinesand systems are regularly reviewed andadjusted to changes in markets andproducts. The Group manages andmonitors these risks primarily through itsoperating and financing activities.The Audit Committee of the Companyoversees how management monitorscompliance with the Company’s riskmanagement policies and procedures,and reviews the adequacy of the riskmanagement framework in relation to therisks faced by the Company. The AuditCommittee is assisted in its oversight roleby Internal Audit. Internal Audit undertakesboth regular and ad hoc reviews of riskmanagement controls and procedures, theresults of which are reported to the AuditCommittee.36.1 Credit riskCredit risk is the risk that a counter partywill not meet its obligations under a financialinstrument or customer contract, leadingto a financial loss. The Group is exposedto credit risk from its operating activities(primarily trade receivables) and from itsfinancing activities, including deposits withbanks and financial institutions, foreignexchange transactions and other financialinstruments.The Group trades only with recognised,credit worthy third parties. It is the Group’spolicy that all clients who wish to trade oncredit terms are subject to credit verificationprocedures. In addition, receivable balancesare monitored on an ongoing basis withthe result that the Group’s exposure to baddebts is not significant.With respect to credit risk arising from theother financial assets of the Group, suchas cash and cash equivalents, the Group’sexposure to credit risk arises from defaultof the counter party. The Group managesits operations to avoid any excessiveconcentration of counter party risk and theGroup takes all reasonable steps to ensurethe counter parties fulfill their obligations.36.1.1 Credit risk exposureCredit risk is the risk of financial loss tothe Group, if a customer or counter partyto a financial instrument fails to meetits contractual obligations, and arisesprincipally from the Group’s receivablesfrom customers and placements in depositswith banking institutions and in governmentsecurities.
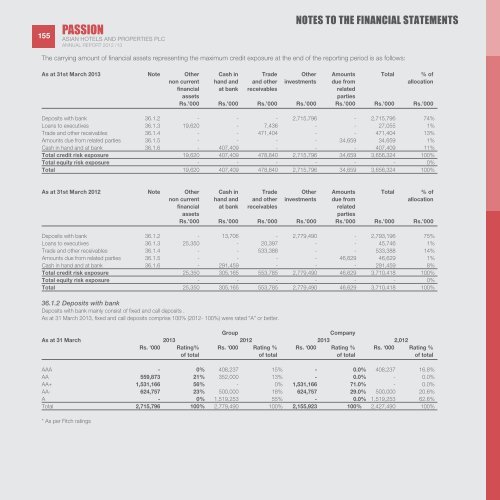
PASSION155 <strong>ASIAN</strong> <strong>HOTELS</strong> <strong>AND</strong> <strong>PROPERTIES</strong> <strong>PLC</strong>Annual Report <strong>2012</strong> /<strong>13</strong>notes to the financial statementsThe carrying amount of financial assets representing the maximum credit exposure at the end of the reporting period is as follows:As at 31st March 20<strong>13</strong> Note Other Cash in Trade Other Amounts Total % ofnon current hand and and other investments due from allocationfinancial at bank receivables relatedassetspartiesRs.’000 Rs.’000 Rs.’000 Rs.’000 Rs.’000 Rs.’000 Rs.’000Deposits with bank 36.1.2 - - - 2,715,796 - 2,715,796 74%Loans to executives 36.1.3 19,620 - 7,436 - - 27,055 1%Trade and other receivables 36.1.4 - - 471,404 - - 471,404 <strong>13</strong>%Amounts due from related parties 36.1.5 - - - - 34,659 34,659 1%Cash in hand and at bank 36.1.6 - 407,409 - - - 407,409 11%Total credit risk exposure 19,620 407,409 478,840 2,715,796 34,659 3,656,324 100%Total equity risk exposure - - - - - - 0%Total 19,620 407,409 478,840 2,715,796 34,659 3,656,324 100%As at 31st March <strong>2012</strong> Note Other Cash in Trade Other Amounts Total % ofnon current hand and and other investments due from allocationfinancial at bank receivables relatedassetspartiesRs.’000 Rs.’000 Rs.’000 Rs.’000 Rs.’000 Rs.’000 Rs.’000Deposits with bank 36.1.2 - <strong>13</strong>,706 - 2,779,490 - 2,793,196 75%Loans to executives 36.1.3 25,350 - 20,397 - - 45,746 1%Trade and other receivables 36.1.4 - - 533,388 - - 533,388 14%Amounts due from related parties 36.1.5 - - - - 46,629 46,629 1%Cash in hand and at bank 36.1.6 - 291,459 - - - 291,459 8%Total credit risk exposure 25,350 305,165 553,785 2,779,490 46,629 3,710,418 100%Total equity risk exposure - - - - - - 0%Total 25,350 305,165 553,785 2,779,490 46,629 3,710,418 100%36.1.2 Deposits with bankDeposits with bank mainly consist of fixed and call deposits .As at 31 March 20<strong>13</strong>, fixed and call deposits comprise 100% (<strong>2012</strong>- 100%) were rated “A” or better.GroupCompanyAs at 31 March 20<strong>13</strong> <strong>2012</strong> 20<strong>13</strong> 2,012Rs. ‘000 Rating% Rs. ‘000 Rating % Rs. ‘000 Rating % Rs. ‘000 Rating %of total of total of total of totalAAA - 0% 408,237 15% - 0.0% 408,237 16.8%AA 559,873 21% 352,000 <strong>13</strong>% - 0.0% - 0.0%AA+ 1,531,166 56% - 0% 1,531,166 71.0% - 0.0%AA- 624,757 23% 500,000 18% 624,757 29.0% 500,000 20.6%A - 0% 1,519,253 55% - 0.0% 1,519,253 62.6%Total 2,715,796 100% 2,779,490 100% 2,155,923 100% 2,427,490 100%* As per Fitch ratings