

ASIAN HOTELS AND PROPERTIES PLC AnnuAl RepoRt 2012/13
ASIAN HOTELS AND PROPERTIES PLC AnnuAl RepoRt 2012/13
ASIAN HOTELS AND PROPERTIES PLC AnnuAl RepoRt 2012/13

You also want an ePaper? Increase the reach of your titles
YUMPU automatically turns print PDFs into web optimized ePapers that Google loves.
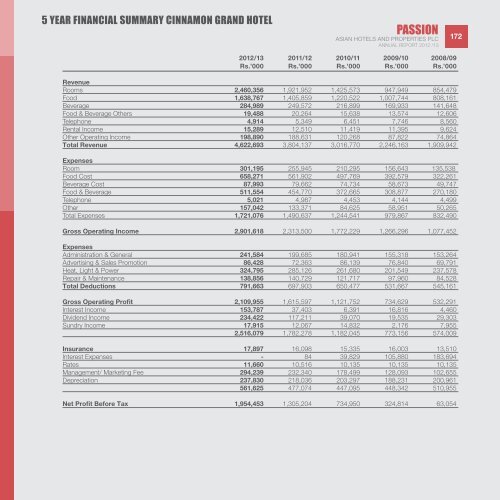
5 year financial summary cinnamon grand hotelPASSION<strong>ASIAN</strong> <strong>HOTELS</strong> <strong>AND</strong> <strong>PROPERTIES</strong> <strong>PLC</strong>Annual Report <strong>2012</strong> /<strong>13</strong>172<strong>2012</strong>/<strong>13</strong> 2011/12 2010/11 2009/10 2008/09Rs.’000 Rs.’000 Rs.’000 Rs.’000 Rs.’000RevenueRooms 2,460,356 1,921,952 1,425,573 947,949 854,479Food 1,638,767 1,405,859 1,220,522 1,007,744 808,161Beverage 284,989 249,572 216,899 169,933 141,648Food & Beverage Others 19,488 20,264 15,638 <strong>13</strong>,574 12,606Telephone 4,914 5,349 6,451 7,746 8,560Rental Income 15,289 12,510 11,419 11,395 9,624Other Operating Income 198,890 188,631 120,268 87,822 74,864Total Revenue 4,622,693 3,804,<strong>13</strong>7 3,016,770 2,246,163 1,909,942ExpensesRoom 301,195 255,945 210,295 156,643 <strong>13</strong>5,538Food Cost 658,271 561,902 497,769 392,579 322,261Beverage Cost 87,993 79,662 74,734 58,673 49,747Food & Beverage 511,554 454,770 372,665 308,877 270,180Telephone 5,021 4,987 4,453 4,144 4,499Other 157,042 <strong>13</strong>3,371 84,625 58,951 50,265Total Expenses 1,721,076 1,490,637 1,244,541 979,867 832,490Gross Operating Income 2,901,618 2,3<strong>13</strong>,500 1,772,229 1,266,296 1,077,452ExpensesAdministration & General 241,584 199,685 180,941 155,318 153,264Advertising & Sales Promotion 86,428 72,363 86,<strong>13</strong>9 76,840 69,791Heat, Light & Power 324,795 285,126 261,680 201,549 237,578Repair & Maintenance <strong>13</strong>8,856 140,729 121,717 97,960 84,528Total Deductions 791,663 697,903 650,477 531,667 545,161Gross Operating Profit 2,109,955 1,615,597 1,121,752 734,629 532,291Interest Income 153,787 37,403 6,391 16,816 4,460Dividend Income 234,422 117,211 39,070 19,535 29,303Sundry Income 17,915 12,067 14,832 2,176 7,9552,516,079 1,782,278 1,182,045 773,156 574,009Insurance 17,897 16,098 15,335 16,003 <strong>13</strong>,510Interest Expenses - 84 39,829 105,880 183,694Rates 11,660 10,516 10,<strong>13</strong>5 10,<strong>13</strong>5 10,<strong>13</strong>5Management/ Marketing Fee 294,239 232,340 178,499 128,093 102,655Depreciation 237,830 218,036 203,297 188,231 200,961561,625 477,074 447,095 448,342 510,955Net Profit Before Tax 1,954,453 1,305,204 734,950 324,814 63,054


