TROLL 9500 Operator's Manual - Geotech Environmental Equipment
TROLL 9500 Operator's Manual - Geotech Environmental Equipment
TROLL 9500 Operator's Manual - Geotech Environmental Equipment

Create successful ePaper yourself
Turn your PDF publications into a flip-book with our unique Google optimized e-Paper software.
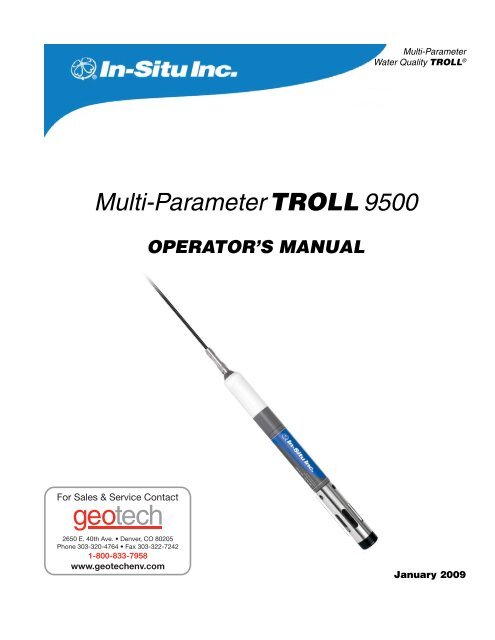
Multi-ParameterWater Quality <strong>TROLL</strong> ®Multi-Parameter <strong>TROLL</strong> <strong>9500</strong>Operator’s <strong>Manual</strong>January 2009
Copyright © 2001 – 2009 by In-Situ Inc. All rights reserved.Revision history Beta draft September 23, 2005Initial release, October 28, 2005Rev. 001, April 6, 2006Rev. 002, November 2006Rev. 003, April 2007Rev. 004a, September 2007Rev. 005, April 2008Rev. 006, September 2008Rev. 007, January 2009This document contains proprietary information which is protected by copyright. No part of this document may be photocopied, reproduced, or translated toanother language without the prior written consent of In-Situ Inc.Mailing & Shipping Address: Phone: 970 498 1500In-Situ Inc. Fax: 970 498 1598221 E. Lincoln Ave. Internet: www.in-situ.comFort Collins, CO 80524 Support Line: 800 446 7488USA(US & Canada)The information in this document is subject to change without notice. In-Situ Inc. has made a reasonable effort to be sure that the information contained herein iscurrent and accurate as of the date of publication.In-Situ Inc. makes no warranty of any kind with regard to this material, including, but not limited to, its fitness for a particular application. In-Situ will not be liablefor errors contained herein or for incidental or consequential damages in connection with the furnishing, performance, or use of this material.In no event shall In-Situ Inc. be liable for any claim for direct, incidental, or consequential damages arising out of, or in connection with, the sale, manufacture,delivery, or use of any product.Images in this manual have been selected for illustration; actual images may vary from those shown.In-Situ and the In-Situ logo, Win-Situ, <strong>TROLL</strong>, Baro<strong>TROLL</strong>, HERMIT, RuggedReader, RuggedCable, and RDO are trademarks or registered trademarks ofIn-Situ Inc. Microsoft, Windows, Windows Vista, Internet Explorer, Excel, and ActiveSync are trademarks or registered trademarks of Microsoft Corporation.Teflon and Delrin are registered trademarks of E. I. DuPont de Nemours and Company. Viton is a registered trademark of DuPont Dow Elastomers. Kellems isa registered trademark of Hubbell Inc. NIST is a registered trademark of the National Institute of Standards and Technology. Alconox is a registered trademark ofAlconox Inc. Other brand names and trademarks are the property of their respective owners.
Multi-ParameterWater Quality <strong>TROLL</strong> ®Contents1 Introduction................................................. 1General Description of the MP <strong>TROLL</strong> <strong>9500</strong>....................................... 1How to Use This <strong>Manual</strong>..................................................................... 1Conventions................................................................................ 2Unpacking and Inspection................................................................... 2Serial Number............................................................................. 2To Our Customers . . .......................................................................... 2What We Provide................................................................................ 3Warranty Provisions.................................................................... 3Firmware & Software Upgrades................................................. 3How to Contact Us.............................................................................. 3To Obtain Repair Service (U.S.)........................................ 3Outside the U.S................................................................. 3Certification......................................................................................... 3Cleaning Guidelines............................................................................ 42 Components & Features................................ 5System Description ............................................................................ 5Standard Features............................................................................... 5Optional Features................................................................................ 5Cables ................................................................................................ 6RuggedCable.......................................................................... 6Cable Desiccants........................................................................ 7Communication Cables.............................................................. 7Power Components............................................................................. 7Internal Power............................................................................ 7External Power .......................................................................... 7Water Quality Accessories .................................................................. 8Installation Accessories....................................................................... 9Control Software.................................................................................. 9Product Specifications....................................................................... 103 Getting Started...........................................12Provide Power................................................................................... 12Install Sensors................................................................................... 13Install the Software ........................................................................... 14Win-Situ 4 ................................................................................ 14USB <strong>TROLL</strong> Com Drivers......................................................... 14Pocket-Situ 4 ........................................................................... 14Win-Situ Sync........................................................................... 14Connect the Hardware...................................................................... 14<strong>TROLL</strong> <strong>9500</strong> to <strong>TROLL</strong> Com.................................................... 14<strong>TROLL</strong> Com to Computer......................................................... 14Twist-Lock Cable Connections................................................. 15Establish Communication with the MP <strong>TROLL</strong> <strong>9500</strong>......................... 16Set the Real-Time Clock.................................................................... 16Quick-Cal the Basic Water-Quality Sensors...................................... 17Calibrate the Extended Sensors........................................................ 20Set Up Custom Pressure/Level Measurements................................ 20Set Up to Log Data (Set Up a Test)................................................... 21Complete the Setup........................................................................... 214 Control Software...................................... 22Launching the Software..................................................................... 22Win-Situ 4................................................................................. 22Pocket-Situ 4............................................................................ 22The User Interface............................................................................. 23The Navigation Tree................................................................. 23Software Functions............................................................................ 24Configuring the Port.................................................................. 24Establishing Communication with the MP <strong>TROLL</strong> <strong>9500</strong>........... 24New Connection.............................................................. 24Existing Connection......................................................... 24Displaying Device Information.................................................. 24Upgrading Firmware and Features........................................... 25Editing the Device Properties................................................... 26Setting a Device Name.................................................... 26Setting the Real-Time Clock............................................ 26Setting Battery Information.............................................. 26SDI-12 and ASCII Mode Preferences.............................. 26Choosing Measurement Units and Other Preferences............. 27Choosing Pressure Display & Conversion Options.................. 28Logging Data (Adding a Test)................................................... 29Taking “<strong>Manual</strong>” Readings........................................................ 29Extracting and Viewing Data.................................................... 30Deleting Data from Instrument Memory.................................... 30Exiting the Software.......................................................................... 30Win-Situ 4................................................................................. 30Pocket-Situ 4............................................................................ 305 Profiling......................................................31Profiler Features................................................................................ 31Starting the Profiler............................................................................ 31Graphing Profiler Data....................................................................... 32Profiling Dissolved Oxygen............................................................... 32Profiling Pressure or Depth............................................................... 32Profiling Turbidity............................................................................... 32<strong>TROLL</strong> <strong>9500</strong> Operator’s <strong>Manual</strong>iii0095110 rev. 007 01/09
ContentsCustomizing the Profiler.................................................................... 34Changing the Channels Displayed.................................. 34Changing Measurement Units ........................................ 34Changing the Sample Rate.............................................. 34Starting in Profiler Mode.................................................. 34Logging Profiler Data......................................................................... 34To Stop Logging ....................................................................... 34Retrieving Logged Profiler Data............................................... 34Exiting the Profiler............................................................................. 346 Logging Data.............................................. 35Adding a Test to a Device: The Test Wizard...................................... 35Test Setup Parameters............................................................. 361. Test Name (Optional)................................................... 362. Parameters to Include.................................................. 363. Measurement Schedule .............................................. 364. Measurement Interval.................................................. 375. Start Mode................................................................... 37Ending Setup............................................................................ 37More on Measurement Schedules.................................................... 37Linear ....................................................................................... 37Event ....................................................................................... 37Linear Average......................................................................... 38Other Test Operations....................................................................... 39Starting a <strong>Manual</strong> Start Test..................................................... 40Stopping a Test......................................................................... 40Retrieving Logged Data............................................................ 40Deleting Tests........................................................................... 41Cloning a Test........................................................................... 41Transferring Files from a PDA to a Desktop PC................................ 42Viewing Logged Data........................................................................ 43Selecting Data in the Data Folder............................................. 43Graphing Data................................................................................... 44Changing the Data Display................................................................ 45Transferring Data to Excel from Win-Situ 4....................................... 45Printing Data in Win-Situ 4................................................................ 45Saving Text Files from Win-Situ 4...................................................... 457 Monitoring Pressure (Water Level)........... 46Why Monitor Pressure?..................................................................... 46The Pressure Sensor........................................................................ 46Factory Calibration................................................................... 46Operating Principle................................................................... 47Non-Vented (Absolute) vs. Vented (Gauged) Sensors............. 47Pressure vs. Depth vs. Level.................................................... 47Zeroing the Pressure Sensor............................................................ 47Setting up Pressure Measurements: The Parameter Wizard............ 48Pressure Setup Choices........................................................... 481. Name (Optional)................................................................... 482. Display Mode........................................................................ 483. Converting Pressure to Depth or Level................................ 49Conversion Using Specific Gravity.................................. 49Conversion Using Density, Latitude, and Elevation......... 494. Level Reference................................................................... 49Reference Time............................................................... 49Quick Summary of Pressure Setup................................................... 50Installation for Pressure/Level Measurement.................................... 51Securing the Cable................................................................... 51Stabilization Time..................................................................... 51Twist-Lock Hanger Installations................................................ 51Installation Tips for Level/Depth/Pressure Monitoring..... 51Correcting Absolute Pressure Readings for Barometric Pressure.... 52<strong>Manual</strong> Barometric Pressure Compensation............................ 52Using the MP <strong>TROLL</strong>’s Barometric Pressure Sensor...... 52Using a Second Unit and a Spreadsheet......................... 52Automatic Barometric Pressure Compensation ....................... 52Collecting Barometric Pressure Data for Reference........ 52Collecting PSIA Data....................................................... 52Using the Baro Wizard..................................................... 52Recalibration Recommendations...................................................... 538 Monitoring Temperature........................... 54Why Monitor Temperature?............................................................... 54The Temperature Sensor................................................................... 54Role of the Sensor in Calibration ............................................. 55Software Functions............................................................................ 55References........................................................................................ 559 Monitoring Barometric Pressure.............. 56What is Barometric Pressure?........................................................... 56Why Monitor Barometric Pressure?.................................................. 56The Barometric Pressure Sensor...................................................... 56Collecting Accurate Measurements without Vented Cable................ 56Pressure vs. Elevation.............................................................. 5710 Monitoring Water Quality: Overview...... 58Why Monitor Water Quality?.............................................................. 58The Sensors...................................................................................... 58Basic Sensor Set...................................................................... 58Installing Sensors..................................................................... 59Removing Sensors................................................................... 60Calibration Overview......................................................................... 60Traditional Calibration............................................................... 60Quick Calibration...................................................................... 61Out of the Box........................................................................... 61Default Coefficients.................................................................. 61Preparing to Calibrate....................................................................... 61Calibration Kits ........................................................................ 61The Calibration Cup.................................................................. 61Effect of Temperature on Calibration........................................ 62Rinsing...................................................................................... 62Stirring...................................................................................... 62Calibration Procedures...................................................................... 62After Calibration.................................................................................62Calibration History.................................................................... 63How Often to Calibrate ............................................................ 64How to Check if a Sensor is Still in Calibration......................... 64When to Replace a Sensor....................................................... 65References........................................................................................ 6511 pH............................................................... 66What Is pH? ...................................................................................... 66Why Measure pH? ................................................................... 66The pH Sensor ................................................................................. 66Sensor Installation............................................................................. 67<strong>TROLL</strong> <strong>9500</strong> Operator’s <strong>Manual</strong>iv0095110 rev. 007 01/09
ContentsCalibration ........................................................................................ 67Overview................................................................................... 67Nominal vs. Stable........................................................... 68Calibration Solutions................................................................. 68Recommended Calibration Frequency..................................... 68pH Quick Cal............................................................................ 68Traditional pH Calibration Procedure........................................ 68Recommended Calibration Order for pH and ORP.................. 68Resetting Default Coefficients.................................................. 70Sensor Slope and Offset.......................................................... 70Units and Calculated Measurements................................................ 70Usage Recommendations and Cautions........................................... 70Sensor Care and Handling ............................................................... 71Sensor Removal....................................................................... 71Maintenance/Inspection/Cleaning............................................ 71Replacing the Filling Solution .................................................. 71Replacing the Junction............................................................. 71Storage .................................................................................... 71References........................................................................................ 7112 Conductivity...............................................72What Is Conductivity?........................................................................ 72Why Measure Conductivity?..................................................... 72How is Conductivity Measured?............................................... 72The Conductivity Sensors ................................................................ 72Sensor Installation............................................................................. 73Calibration......................................................................................... 73Overview................................................................................... 73Nominal vs. Stable........................................................... 73Calibration Solutions (Primary Standards)............................... 73Calibrating with Other Solutions...................................... 73Recommended Calibration Frequency..................................... 73Conductivity Quick Cal............................................................. 74Traditional Conductivity Calibration Procedure......................... 74Using a Conductivity Meter as a Secondary Standard............. 76Entering a Cell Constant <strong>Manual</strong>ly........................................... 76Units and Calculated Measurements................................................ 76Basic Unit: AC.................................................................. 76Specific Conductance (SC).............................................. 76Total Dissolved Solids (TDS)........................................... 77Resistivity ........................................................................ 77Salinity............................................................................. 77Usage Recommendations and Cautions........................................... 77Conductivity and Temperature.................................................. 77Sensor Care and Handling................................................................ 77Sensor Removal....................................................................... 77Maintenance/Inspection/Cleaning............................................ 77Storage..................................................................................... 77References........................................................................................ 7713 Dissolved Oxygen...................................... 78What is Dissolved Oxygen?.............................................................. 78Why Measure Dissolved Oxygen? .......................................... 78Polarographic Measurement of Dissolved Oxygen........................... 79The Polarographic Dissolved Oxygen Sensor................................... 79Theory of Operation.................................................................. 79Sensor Conditioning................................................................. 79Sensor Installation............................................................................. 79Fill the Membrane Module....................................................... 79Install the Sensor in the MP <strong>TROLL</strong> <strong>9500</strong>................................ 80Condition a Newly Installed Sensor......................................... 80Calibration........................................................................................ 80Overview................................................................................... 80Nominal vs. Stable........................................................... 81Calibration Solutions & <strong>Equipment</strong>........................................... 81Recommended Calibration Frequency..................................... 81Dissolved Oxygen Calibration Tips........................................... 81Dissolved Oxygen Quick Cal.................................................... 81Traditional Dissolved Oxygen Calibration Procedure............... 81Usage Recommendations and Cautions........................................... 86Attaching the Stirrer......................................................... 86Starting the Stirrer............................................................ 86Sensor Care and Handling................................................................ 87Sensor Removal....................................................................... 87Maintenance/Inspection............................................................ 87Replacing the Membrane Module............................................. 87Sensor Life............................................................................... 87References........................................................................................ 88Optical Measurement of Dissolved Oxygen...................................... 89The RDO Optical Dissolved Oxygen Sensor..................................... 89The RDO Sensor and Salinity.......................................... 89Unpack the RDO Cable connect Sensor.................................. 89Unpack the RDO Direct connect Sensor.................................. 90Installing the RDO Sensor CAP................................................ 90INstalling the RDO Sensor....................................................... 90Calibration......................................................................................... 91Overview................................................................................... 91Nominal vs. Stable........................................................... 91Calibration Solutions................................................................. 92Recommended Calibration Frequency..................................... 92Traditional 2-Point Calibration.................................................. 92Oxygen Saturation Point........................................................... 92Zero Oxygen Point.................................................................... 93Barometric Pressure Options........................................... 93Finalize the Calibration............................................................. 94Status indicators: ............................................................ 94Clean-up.......................................................................... 95Units and Calculated Measurements................................................ 95Usage Recommendations and Cautions........................................... 95Salinity............................................................................. 95Sensor Care and Handling................................................................ 95Biofouling.................................................................................. 95Cleaning the Sensor Cap................................................. 96Cleaning the Optical Window (Perform only if changing thecap)......................................................................... 96Cleaning the Sensor Body............................................... 96Storage............................................................................ 96Replacing the Sensor Cap............................................... 96<strong>TROLL</strong> <strong>9500</strong> Operator’s <strong>Manual</strong>v0095110 rev. 007 01/09
Contents14 Oxidation-Reduction Potential................ 97What is ORP? ................................................................................... 97Why Measure ORP?................................................................. 97The pH/ORP Sensor......................................................................... 97Sensor Installation............................................................................. 98Calibration......................................................................................... 98Overview................................................................................... 98Calibration Solutions................................................................. 98Recommended Calibration Order for pH and ORP.................. 99Traditional ORP Calibration Procedure.................................... 99Resetting Default Coefficients................................................ 100Sensor Offset.......................................................................... 100Units and Calculated Measurements.............................................. 100Recommended Calibration Frequency............................................ 100Normalization to Standard Hydrogen Electrode Values.................. 100Usage Recommendations and Cautions......................................... 101Sensor Care and Handling.............................................................. 101Sensor Removal..................................................................... 101Maintenance/Inspection/Cleaning.......................................... 101Replacing the Filling Solution ................................................ 101Replacing the Junction........................................................... 101Storage................................................................................... 101References...................................................................................... 10115 Ammonium............................................... 104What is Ammonium ? ..................................................................... 104Why Measure Ammonium? ................................................... 104The Ammonium Sensor................................................................... 104Sensor Preparation................................................................. 104The Nitrogen Cycle................................................................. 104Sensor Installation.................................................................. 105Calibration....................................................................................... 105Overview................................................................................. 105Calibration Solutions............................................................... 105Recommended Calibration Frequency................................... 106Preparing to Calibrate............................................................. 106Ammonium Calibration Procedure.......................................... 106Sensor Slope and Offset........................................................ 108Units and Calculated Measurements.............................................. 108Usage Recommendations and Cautions......................................... 108pH ....................................................................................... 108Temperature........................................................................... 108Conductivity............................................................................ 108Potential Interferences............................................................ 108Sensor Care and Handling.............................................................. 109Sensor Removal..................................................................... 109Maintenance/Inspection/Cleaning.......................................... 109Storage................................................................................... 109References...................................................................................... 10916 Chloride.................................................... 110What Is Chloride?............................................................................ 110Why Measure Chloride?......................................................... 110The Chloride Sensor....................................................................... 110Sensor Preparation................................................................. 110Sensor Installation.................................................................. 110Calibration........................................................................................111Overview..................................................................................111Calibration Solutions................................................................111Recommended Calibration Frequency....................................111Preparing to Calibrate..............................................................111Chloride Calibration Procedure.............................................. 112Sensor Slope and Offset........................................................ 114Units and Calculated Measurements.............................................. 114Usage Recommendations and Cautions......................................... 114pH Effects............................................................................... 114Potential Interferences............................................................ 114Sensor Care and Handling.............................................................. 114Sensor Removal..................................................................... 114Maintenance/Inspection/Cleaning.......................................... 114Storage................................................................................... 11417 Nitrate...................................................... 115What Is Nitrate ?.............................................................................. 115Why Measure Nitrate?............................................................ 115The Nitrate Sensor.......................................................................... 115Sensor Preparation................................................................. 116Sensor Installation.................................................................. 116Calibration....................................................................................... 116Overview................................................................................. 116Calibration Solutions............................................................... 117Recommended Calibration Frequency................................... 117Preparing to Calibrate............................................................. 117Nitrate Calibration Procedure................................................. 117Sensor Slope and Offset........................................................ 119Units and Calculated Measurements.............................................. 119Usage Recommendations and Cautions......................................... 119Temperature........................................................................... 119Potential Interferences............................................................ 120Sensor Care and Handling.............................................................. 120Sensor Removal..................................................................... 120Maintenance/Inspection/Cleaning.......................................... 120Storage................................................................................... 120References...................................................................................... 12018 Turbidity................................................... 121What Is Turbidity?............................................................................ 121Why Measure Turbidity?......................................................... 121How Is Turbidity Measured?................................................... 121The Turbidity Sensor....................................................................... 122The Turbidity Wiper......................................................................... 122Wiper Installation.................................................................... 123Wiper Movement.................................................................... 123<strong>Manual</strong> Wipe........................................................................... 124Wiper Guidelines and Precautions......................................... 124Calibration....................................................................................... 124Factory Calibration................................................................. 124Field Calibration...................................................................... 124Calibration Solutions............................................................... 124Recommended Calibration Frequency................................... 125Turbidity Calibration Procedure.............................................. 125Resetting Default Coefficients................................................ 128Sensor Slope and Offset........................................................ 128Units and Calculated Measurements.............................................. 128Usage Recommendations and Cautions......................................... 128Common Interferences........................................................... 128Profiling Turbidity............................................................................. 128Logging Turbidity Data.................................................................... 128<strong>TROLL</strong> <strong>9500</strong> Operator’s <strong>Manual</strong>vi0095110 rev. 007 01/09
ContentsSensor Care.................................................................................... 128Inspection/Maintenance/Cleaning.......................................... 128Wiper Maintenance......................................................................... 129References...................................................................................... 12919 SDI-12 Operation.......................................130SDI-12 Requirements...................................................................... 130Wiring.............................................................................................. 130Connections.................................................................................... 130SDI-12 Support................................................................................ 130Sensor Identification............................................................... 131Sensor Verification.................................................................. 131Making SDI-12 Measurements........................................................ 131Redundant Logging (Win-Situ 4 and SDI-12).................................. 132Extended (ISCO) Commands.......................................................... 132Reference........................................................................................ 132SDI-12 V 1.3 Command Set................................................... 13320 Low-Flow Monitoring.............................135Preparation...................................................................................... 135RDO Sensor Preparation........................................................ 135Prepare the Flow Cell............................................................. 135Start the Software............................................................................ 136Launch the Flow-Sense Wizard...................................................... 136Verify Unit Preferences........................................................... 136Flow-Sense Wizard Input....................................................... 137Saving the Low-Flow Data or Template........................................... 138Output.............................................................................................. 139Export to Excel Option..................................................................... 139Using a Custom Excel Template............................................. 13921 Care & Maintenance................................. 141Replacing Batteries ........................................................................ 141O-Ring Seals................................................................................... 141Lubrication.............................................................................. 141Replacement.......................................................................... 142General Cleaning............................................................................ 142Storage............................................................................................ 142Sensor Storage ...................................................................... 142Twist-Lock Connectors........................................................... 14222 Troubleshooting.....................................143Troubleshooting Connections.......................................................... 143Troubleshooting Data Collection (Tests).......................................... 143Troubleshooting Sensors................................................................. 144Troubleshooting Calibration ............................................................ 144Appendix........................................................145Electronic Drift and Device Recalibration........................................ 145Determining Density........................................................................ 145Glossary........................................................147<strong>TROLL</strong> <strong>9500</strong> Operator’s <strong>Manual</strong>vii0095110 rev. 007 01/09
Multi-ParameterWater Quality <strong>TROLL</strong> ®1 IntroductionGeneral Description of the MP <strong>TROLL</strong><strong>9500</strong>Your new Multi-Parameter <strong>TROLL</strong> <strong>9500</strong> water quality probe usesthe latest sensor and electronics technology to provide a robust,durable, and user-friendly instrument.The MP <strong>TROLL</strong> <strong>9500</strong> logs data from up to 7 water-level andwater-quality sensors, as well as built-in temperature and barometricpressure sensors. Many custom options and versions areavailable, so your instrument may not look exactly like those wehave chosen to illustrate in this manual.The MP <strong>TROLL</strong> <strong>9500</strong> provides the convenience of a laboratory-qualitymeasurement instrument for field use, providing truein-situ monitoring of water level and water quality.How to Use This <strong>Manual</strong>This operator’s manual is designed as both a start-up guide anda permanent reference for the features, uses, and applications ofthe Multi-Parameter <strong>TROLL</strong> <strong>9500</strong>.Section 1: Introduction to this Operator’s <strong>Manual</strong> and to In-SituInc.; contacting us for warranty and repair issuesSection 2: Description of components and features of the Multi-Parameter <strong>TROLL</strong> <strong>9500</strong>Section 3: Getting Started: setting up the software, connectingfor the first time, Quick-Calibrating the sensors, and a summaryoverview of the setup to start collecting dataSection 4: Control Software: Win-Situ ® 4 and Pocket-Situ 4Section 5: ProfilingSection 6: How to set up tests and start logging data; extractingdata to your PC; viewing and graphing dataSection 7: Monitoring Pressure (Water Level): Info on the two basictypes of pressure sensors; setting up the pressure channel to obtainthe most accurate readings for your altitude and latitude; how todisplay data as you wish to see itSection 8: TemperatureSection 9: Barometric PressureSection 10: An overview of monitoring water quality with the MP<strong>TROLL</strong> <strong>9500</strong>: Sensor installation and calibration, software options,calibration reportsSection 11: pHSection 12: ConductivitySection 13: Dissolved Oxygen: Polarographic (Clark cell)RDO ® Optical Dissolved OxygenSection 14: Oxidation-Reduction Potential (ORP)Section 15: AmmoniumSection 16: ChlorideSection 17: NitrateSection 18: TurbiditySection 19: SDI-12 OperationSection 20: Low-Flow MonitoringSection 21: Care and Maintenance adviceSection 22: Troubleshooting: Look here first if you have problemsmaking connections or calibrating . . .The manual includes a Glossary and a comprehensive Index<strong>TROLL</strong> <strong>9500</strong> Operator’s <strong>Manual</strong> 10095110 rev. 007 01/09
Section 1: IntroductionConventionsThroughout this operator’s manual you will see the following symbols.The check mark highlights a tip about a convenient featureof the MP <strong>TROLL</strong> <strong>9500</strong>The exclamation point calls your attention to a requirementor important action that should not be overlookedTypical usage questions and answers that we hope will help you gaina better understanding of your new Multi-Parameter <strong>TROLL</strong> <strong>9500</strong>and simplify its setup and operationUnpacking and InspectionYour MP <strong>TROLL</strong> <strong>9500</strong> was carefully inspected before shipping. Checkthe instrument for any physical damage sustained during shipment.Notify In-Situ and file a claim with the carrier if there is any such damage;do not attempt to operate the instrument.Please save packing materials for future storage and shipping of yourMP <strong>TROLL</strong> <strong>9500</strong>. The shipping boxes have been performance-testedand provide protection for the instrument and its accessories.Accessories may be shipped separately and should also be inspectedfor physical damage and the fulfillment of your order.Serial NumberThe serial number is located on the large label on the Multi-Parameter<strong>TROLL</strong> <strong>9500</strong> body, and also on a small label inside the batterycompartment. The serial number is programmed into the instrumentand displayed when the instrument is connected to a PC running Win-Situ 4 or Pocket-Situ 4. We recommend that owners keep a separaterecord of this number. Should your Multi-Parameter <strong>TROLL</strong> <strong>9500</strong> belost or stolen, the serial number is often necessary for tracing andrecovery, as well as any insurance claims. If necessary, In-Situ maintainscomplete records of original owner’s names and serial numbers.Serial numbers of the water-quality sensors are stored in sensormemory and displayed in the software when sensors are installed.To Our Customers . . .Thank you for your purchase of an In-Situ product. We are gladyou chose us and our products to help you with your environmentalmonitoring needs. In-Situ Inc. has been designing and manufacturingworld-class environmental monitoring instrumentation for over 25years in the Rocky Mountains of the United States. As it was in thebeginning, our expectation is that this product will provide you withmany trouble-free years of use. To that end, we pride ourselves ondelivering the best customer service and support possible—24 hoursa day, 7 days a week. We believe that this level of commitment toyou, our customer, is imperative in helping you ensure clean, safegroundwater and surface water resources across the globe. Wealso understand the need for accurate, reliable assessments and wecontinue to make significant investments in Research and Developmentto ensure that we deliver the latest product and technologicalinnovations to support your needs.Whether you are gathering information about your body of water fora few moments, or over a period of years, you can rely upon us toprovide you with a quality product and outstanding customer supportat a fair price and have that product delivered to you when and whereyou need it.We want your experience with In-Situ Inc. to be pleasant and professional,whether you are renting from us, or purchasing from us. Wewould be pleased to hear from you and learn more about your needs,and your experiences with our products. Again, we thank you forchoosing In-Situ Inc. and we look forward to serving your needs now,and in the future.Bob Blythe, President and CEOIn-Situ Inc.bblythe@in-situ.com<strong>TROLL</strong> <strong>9500</strong> Operator’s <strong>Manual</strong>2 0095110 rev. 007 01/09
Section 1: IntroductionWhat We ProvideWarranty ProvisionsIn-Situ Inc. warrants the Multi-Parameter <strong>TROLL</strong> <strong>9500</strong> for one year,RDO sensors for three years, and other sensors for 90 days from dateof purchase by the end user against defects in materials and workmanshipunder normal operating conditions. To exercise this warrantycontact Technical Support at the phone or e-mail address listed belowfor a return material authorization (RMA) and instructions. Completewarranty provisions are posted on our website at www.In-Situ.com.Maintenance & calibration plans as well as extended warranties areavailable. Contact your In-Situ representative for complete information.Firmware & Software UpgradesFrom time to time In-Situ may make available enhanced versions offirmware and software to its customers over the Internet.Visit our website at www.in-situ.com to download the latest firmwareand software.How to Contact UsTechnical Support: 800 446 7488Toll-free 24 hours a day in the U.S. and CanadaAddress:In-Situ Inc.221 East Lincoln Ave.Fort Collins, CO 80524USAPhone: 970 498 1500Fax: 970 498 1598Internet:www.in-situ.come-mail:support@in-situ.comTo Obtain Repair Service (U.S.)If you suspect that your Multi-Parameter <strong>TROLL</strong> <strong>9500</strong> is malfunctioningand repair is required, you can help assure efficient servicing byfollowing these guidelines:1. Call or e-mail In-Situ Technical Support (support@in-situ.com).Have the product model and serial number handy.charges. When the pre-approval is received, Tech Support will assignan RMA (Return Material Authorization) number.TIP: Please keep your RMA number for futurereference.4. Clean the Multi-Parameter <strong>TROLL</strong> <strong>9500</strong> and cable. Decontaminatethoroughly if it has been used in a toxic or hazardous environment.See the cleaning guidelines and form on the following page.If an instrument returned for servicing shows evidence ofhaving been used in a toxic or hazardous environment,Customer Service personnel will require written proof ofdecontamination before they can service the unit.5. Carefully pack your Multi-Parameter <strong>TROLL</strong> <strong>9500</strong> in its originalshipping box, if possible. Include a statement certifying that theinstrument and cable have been decontaminated, and any supportinginformation.6. Mark the RMA number clearly on the outside of the box with amarker or label.7. Send the package, shipping prepaid, toIn-Situ Inc.ATTN: Repairs221 East Lincoln Ave.Fort Collins, CO 80524USAThe warranty does not cover damage during transit. We recom mendthe customer insure all shipments. Warranty repairs will be shippedback prepaid.Outside the U.S.Contact your international In-Situ distributor for repair and serviceinformation.CertificationThe MP <strong>TROLL</strong> <strong>9500</strong> complies with all applicable directives per theCE and FCC and was tested to the EN 61326 / FCC specifications2. Be prepared to describe the problem, including how the instrumentwas being used and the conditions noted at the time of themalfunction.3. If Tech Support determines that service is needed, they will askthat your company pre-approve a specified dollar amount for repair<strong>TROLL</strong> <strong>9500</strong> Operator’s <strong>Manual</strong>3 0095110 rev. 007 01/09
Section 1: IntroductionCleaning GuidelinesPlease help us protect the health and safety of our employees bycleaning and decontaminating equipment that has been subjected toany potential biological or health hazards, and labeling such equipment.Unfortunately, we cannot service your equipment without suchnotification. Please complete and sign the form below (or a similarstatement certifying that the equipment has been cleaned and decontaminated)and send it along to us with each downhole instrument.• We recommend a good cleaning solution, such as Alconox ® , aglassware cleaning product available from In-Situ (Catalog No.0029810) and laboratory supply houses.• Clean all cabling. Remove all foreign matter.• Clean cable connector(s) with a clean, dry cloth. Do not submerge.• Clean the probe body—including the nosecone, restrictor, cablehead, and protective caps. Remove all foreign matter.• Remove and clean all removable sensors. Rinse with deionized ordistilled water after cleaning.If an instrument is returned to our Service Centerfor repair or recalibration without a statementthat it has been cleaned and decontaminated,or in the opinion of our Service Representativespresents a potential health or biological hazard,we reserve the right to withhold service untilproper certification has been obtained.Alconox is a registered trademark of Alconox Inc.Decontamination & Cleaning StatementCompany Name____________________________________________Phone_ ________________________Address_________________________________________________________________________________City_ __________________________________ State_ ________________ Zip________________________Instrument Type___________________________________Serial Number____________________________Contaminant(s) (if known)__________________________________________________________________________________________________________________________________________________________Decontamination procedure(s) used__________________________________________________________________________________________________________________________________________________Cleaning verified by_________________________________________ Title____________________________Date________________________________<strong>TROLL</strong> <strong>9500</strong> Operator’s <strong>Manual</strong> 40095110 rev. 007 01/09
Multi-ParameterWater Quality <strong>TROLL</strong> ®2 Components & FeaturesSystem DescriptionThe Multi-Parameter <strong>TROLL</strong> <strong>9500</strong> is a compact, modular system witha range of components to customize the instrument to various applicationsand operational modes. Components include the instrumentbody with a host of options, sensors, cables, external power accessories,and consumable items.Standard Features• 47 mm (1.85 in) diameter• corrosion-resistant PVC housing with titanium set screws• 316L stainless steel flow restrictor/sensor buard• Viton® seals• Fast data sampling• Continuous real-time readings (profiling)• User-replaceable off-the-shelf D-cell alkaline batteries, or In-Situ–supplied 3.6V lithium D-cell batteries• Fully submersible• RS485 communications• Low-power microprocessor• Permanently installed, factory-calibrated temperature sensor• Permanently installed, factory-calibrated barometric pressuresensor, for use on vented cable• Temperature-compensated real-time clock• Easy-to-use Win-Situ ® 4 control software for setup, downloading,text and graphical data display• Optically isolated communication signals• Cable available in standard and custom lengths of vented ornon-vented polyurethane, Halogen-free polyurethane, or Tefzel ®• External power capableOptional Features• Profiler and Professional feature sets, both available in XP withextended parameter capability• Smart Sensors for water quality measurements—removable,replaceable, field-calibrated• Basic Sensors include Dissolved Oxygen (polarographic),pH, combination pH/ORP, Low Conductivity, High Conductivity• The Extended Sensor set includes Ammonium, Chloride,Nitrate, Turbidity, RDO ® Optical Dissolved Oxygen• Pocket-Situ full-featured control software for field use on aPDA—take continuous real-time readings, calibrate, program,and download logged data from multiple MP <strong>TROLL</strong>s• RuggedReader ® handheld PDA• Temperature-compensated vented or non-vented pressuresensor, available in several ranges, permanently installed andfactory-calibrated• Permanently installed, factory-calibrated turbidity sensor• Integral data logging capability—up to 4 megabytes flash datastoragememory (about a million individual readings)• Fast data downloads• Up to 16-test capacity; linear, event, and linear average measurementschedules• SDI-12 or RS485 interface—or both• Flow-Sense low-flow sampling software for automated samplingand report creation• Optional accessories include low-flow flowcell, user-serviceableturbidity wiper, battery-powered magnetic stirrer for use instagnant water• Instrument networking and telemetry<strong>TROLL</strong> <strong>9500</strong> Operator’s <strong>Manual</strong> 50095110 rev. 007 01/09
Section 2: Components & FeaturesCablesSeveral basic cable types are used in the MP <strong>TROLL</strong> <strong>9500</strong> system:MP <strong>TROLL</strong> <strong>9500</strong>RuggedCableTwist-Lock ConnectorSealed Battery Compartment• RuggedCable, TPU-jacketed (Thermoplastic PolyUrethane)• vented or non-vented• Halogen-Free vented or non-vented (LSZH-rated, lowsmoke zero halide)Vented cable is recommended for applications whereaccurate barometric pressure measurement is required—forexample when calibrating dissolved oxygen, or formeasuring DO in percent saturation.• Vented Tefzel®* cable• Stainless steel suspension wire for use when cable venting is notrequired (e.g., with an absolute pressure sensor)• Communication cables for programming the device/downloadingthe logged dataRuggedCableCable includes conductors for power and communication signals, astrength member, and a Kellems ® grip to anchor the MP <strong>TROLL</strong> <strong>9500</strong>securely. Available in standard and custom lengths.Uphole and downhole ends are identical bayonet-typeTwist-Lock connectors that mate with the <strong>TROLL</strong> <strong>9500</strong>body, <strong>TROLL</strong> Com communication cable, desiccants, andother accessories.Sealed BodyStainless steel Restrictor —provides generous openings forcirculation of environmental water,unscrews for installation/removal ofsensorsVented cable is designed for use with vented pressure/level sensors (gauged measure ments). The cable venttube insures that atmospheric pressure is the referencepressure applied to the pressure sensor diaphragm.Vented cable also enables proper functioning of the internalbarometric pressure sensor, and improves dissolvedoxygen readings.Non-vented cable may be used with non-vented pressure/level sensors (absolute measurements), or instrumentswithout a pressure sensor.Acetal Nose Cone minimizes sedimentbuildup and protects the frontend from bottoming out on a hardsurface; removable for installation ofoptional accessories* FEP = fluorinated ethylene propylene, the generic equivalent of DuPont Teflon®.<strong>TROLL</strong> <strong>9500</strong> Operator’s <strong>Manual</strong>6 0095110 rev. 007 01/09
Section 2: Components & FeaturesCable DesiccantsSmall DesiccantClear cap of indicating silica gel desiccant seals the upholeend of the RuggedCable during use; protects the cable venttube and device electronics from condensation. The desiccantis blue when active. It will absorb moisture from thetop down and for best results should be replaced before theentire volume has turned pink. Replacements are availablefrom In-Situ Inc. or your distributor.Large DesiccantThe high-volume desiccant pack may last up to 20 timeslonger than the small desiccant in humid environments. Itattaches to the RuggedCable in the same way. Refill kits areavailable from In-Situ Inc. or your distributor.AccessoryCatalog No.Small desiccant (3).................................................................. 0052230Large desiccant, plastic connector.......................................... 0053550Large desiccant, titanium connector....................................... 0051810Large desiccant refill kit........................................................... 0029140Communication CablesComm cables interface between the <strong>TROLL</strong> <strong>9500</strong> and a desktop/laptopPC or handheld PDA for profiling, calibrating, programming, anddownloading. Both types include 0.9 m (3 ft) polyurethane cable,external power input jack, and ventwith replaceable membrane.External<strong>TROLL</strong> Com (Cable Connect)power inputVentConnects a <strong>TROLL</strong> <strong>9500</strong>’s RuggedCableto a serial or USB port;Weatherproof, withstands a temporaryimmersion (IP67).RS232or USBconnectorTwist-LockconnectorAccessoryCatalog No.RS232 <strong>TROLL</strong> Com, Cable Connect...................................... 0056140RS232 <strong>TROLL</strong> Com, Direct Connect...................................... 0056150USB <strong>TROLL</strong> Com, Cable Connect.......................................... 0052500USB <strong>TROLL</strong> Com, Direct Connect.......................................... 0052510Power ComponentsThe MP <strong>TROLL</strong> <strong>9500</strong> operates in 2 power modes• internal power• external AC line powerInternal PowerThe MP <strong>TROLL</strong> <strong>9500</strong> uses:• two standard 1.5V alkaline D cells, OR• two 3.6V lithium D cells—recommended for use with an RDOoptical dissolved oxygen sensor, and with a turbidity wiperExternal PowerUse only Saft LSH-20 3.6V lithium D cells. Use of any otherlithium battery will void the product warranty.A single MP <strong>TROLL</strong> <strong>9500</strong> can run exclusively on power supplied froma 9 -12 VDC line power supply connected to a 90-264 VAC input.When line power is enabled, the <strong>TROLL</strong> shuts down the battery regulator,thus preserving the internal batteries. All <strong>TROLL</strong> Com modelsinclude an external power input jack.AccessoryCatalog No.AC Adapter 9V........................................................................ 0031880Replacement batteries, alkaline (1)......................................... 0042020Lithium battery (2) kit .............................................................. 0048230TIP: Battery life is dependent upon temperature, cablelength, and how often the device is recording measurements.<strong>TROLL</strong> Com (Direct Connect)Connects a <strong>TROLL</strong> <strong>9500</strong> directly to a serial orUSB port. A good choice for permanent connectionto a PC, or for programming a non-vented<strong>TROLL</strong> <strong>9500</strong> that will be deployed without RuggedCable.Not designed for field use.<strong>TROLL</strong> <strong>9500</strong> Operator’s <strong>Manual</strong>7 0095110 rev. 007 01/09
Section 2: Components & FeaturesWater Quality AccessoriesHigh Nitrate: 2 each 140, 1400 ppm....................................... 0032660Ammonium: 1 each 14 ppm, 140 ppm, 1400 ppm, DI water... 0032140Low Ammonium: 2 each 14, 140 ppm .................................... 0032670High Ammonium: 2 each 140, 1400 ppm................................ 0032680Chloride: 1 each 35.5, 355, 3545 ppm, DI water..................... 0032150Low Chloride: 2 each 35.5, 355 ppm...................................... 0032690Basic SensorsCatalog No.pH ........................................................................................... 0059510pH/ORP .................................................................................. 0059520Low Conductivity .................................................................... 0033210High Conductivity ................................................................... 0033220Polarographic Dissolved Oxygen ........................................... 0032870Extended SensorsCatalog No.Nitrate ..................................................................................... 0032050Ammonium ............................................................................. 0032060Chloride .................................................................................. 0032070RDO Optical Dissolved Oxygen sensorfor use with pressure and/or turbidity sensor, sub-4”.............. 0085070RDO Optical Dissolved Oxygen sensorwithout pressure and/or turbidity sensor, sub-2”..................... 0084310Calibration Kits (four litersunless otherwise noted)Turbidity Wiper........................................................................ 0044510Battery-Powered Magnetic Stirrer........................................... 0042210Calibration KitCatalog No.Quick-Cal: 4 x 250 mL (for calibrating Basic Sensors) ........... 0033250Dissolved Oxygen: 1 liter DI water, 500 mL Na 2SO 3.............. 0032110RDO bubbler cal kit for 0085070 sensor................................. 0048580RDO bubbler cal kit for 0084310 sensor................................. 0080830Polarographic DO bubbler cal kit............................................ 0095150Conductivity: 147 µS, 1413 µS, 12890 µS, DI water............... 0032090Low Conductivity: 2 each 147 µS, 1413 µS .......................... 0032630High Conductivity: 2 each 12890 µS, 58670 µS..................... 0032640pH: 1 each pH 4, pH 7, pH 10, DI water.................................. 0032080ORP: 1 liter Zobell’s Solution ................................................. 0032100pH/ORP: 1 each pH 4, pH 7, pH 10, Zobell’s Solution............ 0032120Nitrate: 1 each 14, 140, 1400 ppm, DI water.......................... 0032130Low Nitrate: 2 each 14, 140 ppm............................................ 0032650Individual Calibration Solutions(one liter unless otherwise noted)High Chloride: 2 each 355, 3545 ppm..................................... 0032700Calibration SolutionCatalog No.Na 2SO 3(Sodium Sulfite) for DO Cal, 500 mL.......................... 0017670Conductivity, 147 µS............................................................... 0032560Conductivity, 1413 µS............................................................. 0020680Conductivity, 12890 µS........................................................... 0020690Conductivity, 58670 µS........................................................... 0032580pH 4......................................................................................... 0006370pH 7......................................................................................... 0006380pH 10....................................................................................... 0006390ZoBell’s Solution (ORP).......................................................... 0032210Nitrate, 14 ppm as N............................................................... 0032520Nitrate, 140 ppm as N............................................................. 0032230Nitrate, 1400 ppm as N........................................................... 0032240Ammonium, 14 ppm as N........................................................ 0032510Ammonium, 140 ppm as N...................................................... 0032260Ammonium, 1400 ppm as N.................................................... 0032270Chloride, 35.5 ppm.................................................................. 0032500Chloride, 355 ppm................................................................... 0032290Chloride, 3545 ppm................................................................. 0032300Turbidity, 10 NTU polymer suspension, 500 mL...................... 0033070Turbidity, 100 NTU polymer suspension, 500 mL.................... 0033100Turbidity, 1000 NTU polymer suspension, 500 mL.................. 0033120Turbidity, 1800 NTU polymer suspension, 500 mL.................. 0033140Maintenance/Service/Replacement PartsCatalog No.Sensor insertion tool............................................................... 0042310Sensor removal tool................................................................ 0042110Cal cup, PVC........................................................................... 0041440Replacement wiper head ....................................................... 0044520Wiper pad replacement kit...................................................... 0044530Lithium battery kit (2 “D” cells, 3.6V ea.)................................. 0048230<strong>TROLL</strong> <strong>9500</strong> Operator’s <strong>Manual</strong>8 0095110 rev. 007 01/09
Section 2: Components & FeaturesMP <strong>TROLL</strong> <strong>9500</strong> Maintenance kit (o-rings, lubricant, dust caps,sensor port plugs).............................................................. 0095100MP <strong>TROLL</strong> <strong>9500</strong> Maintenance kit (o-rings, lubricant, dust caps,sensor port plugs) for use with 0085070 RDO sensors..... 0095100DO sensor service kit, 1-mil membranes................................ 0033200DO sensor service kit, 2-mil membranes................................ 0033440RDO Sensor Cap replacement kit........................................... 0084230RDO Maintenance kit (sensors purchased before 09/08)....... 0048250RDO Foil replacement kit (sensors purch. before 09/08)........ 0048500pH & pH/ORP Reference Filling Solution (60 mL).................. 0056900pH & pH/ORP Reference Junction kit..................................... 0059620pH & pH/ORP Sensor Storage Solution (500 mL).................. 0065370Installation Accessories• Twist-Lock Hanger: stainless steel hanger to suspend a nonvented<strong>TROLL</strong> <strong>9500</strong>, Level <strong>TROLL</strong>, or Baro <strong>TROLL</strong> while takingdata; no venting, no communication capabilities• Cable Extender: connects two lengths of RuggedCable• Wellcaps, locking and vented• Well Docks: top-of-well support for 2”, 4”, or 6” well• SDI-12 adapter: power and signal management for SDI-12 communicationAccessoryCatalog No.Twist-Lock Hanger.................................................................. 0051480Cable Extender....................................................................... 0051490Locking Wellcap, 2” ................................................................ 0020360Locking Wellcap, 2” vented .................................................... 0020370Locking Wellcap, 4” ................................................................ 0020380Locking Wellcap, 4” vented .................................................... 0020390Top-of-well installation ring.................................. WELLDOCK2”, 4”, 6”SDI-12 adapter ....................................................... 0095200, 0095210Flow Cell (sub-2 in)................................................................. 0044710Flow Cell (sub-4 in)................................................................. 0057600Control SoftwareWin-Situ ® 4 enables communication between the MP <strong>TROLL</strong> <strong>9500</strong>and a desktop or laptop PC.Win-Situ provides instrument control for calibration, profiling, directreadings, data logging, data extraction, data viewing (text and graphicalinterface), choice of units and other custom display options, battery/memoryusage tracking, interface to networks and telemetry.System requirements: Microsoft ® Windows ® 2000, Windows XP, orWindows Vista; Internet Explorer (IE) 5.0 or later, and a CD-ROMdrive.Pocket-Situ 4 provides Win-Situ’s features and functions on a fieldportableplatform. Requirements: In-Situ RuggedReader ® or othersupported PDA running Microsoft Pocket PC (Windows Mobile ® )2003 or later, with a serial communications port for connection to the<strong>TROLL</strong> <strong>9500</strong>, and at least 16 megabyte capacity for data storage (SDcard, CF card, or the device’s built-in non-volatile memory).For installation and file exchange, Pocket-Situ requires the followinginstalled on an office desktop or laptop computer:• Microsoft ® ActiveSync ®• Win-Situ 4• Optional: Win-Situ Sync (or Pocket-Sync 4, earlier version ofWin-Situ Sync)Twist-Lock Hanger Cable Extender Locking WellcapWell DockSDI-12 Adapter<strong>TROLL</strong> <strong>9500</strong> Operator’s <strong>Manual</strong>9 0095110 rev. 007 01/09
Section 2: Components & FeaturesProduct SpecificationsWetted Materials*Operating Temperature*Storage Temperature*Pressure Rating*Dimensionswith RDO adapterWeight (without cable)PowerBattery typeExternal power inputPVC, titanium, Viton ® , acetal, 316L SS-5°C to 50°C (23°F to 122°F)-40°C to 80°C (-40°F to 176°F)350 psi (246 m, 807 ft)47 mm (1.85 in) dia, x 57.7 cm (22.7 in)long88.4 mm (3.48 in) dia, 57.7 cm (22.7 in)long1.4 Kg (3.1 lbs)2 standard alkaline D-cells (1.5 V), or2 lithium D cells (approx. 3.6 V)9-12 VDC (optional)Data SamplingMemory type/size (memory 4 megabytes flash data storage, about-equipped models) 1,000,000 individual readingsFastest linear logging rate 5 seconds (10 seconds with RDO)Profiling speed2 secondsCommunicationsComputer interfaceSoftwareWin-Situ ® 4Pocket-Situ 4RS485RS232Desktop/laptop PC with Micro soft ® Windows® 2000 SP2 or later (Windows XP,Windows Vista), Internet Explorer 5.0or later, serial com port, CD-ROM drive,16-64 Mb RAMIn-Situ RuggedReader ® or other supportedhandheld PDA running MicrosoftPocket PC (Windows Mobile ® ) 2003 orlaterCableJacket optionsPolyurethane, halogen-free (HF) polyurethane,Tefzel ®Conductors6 conductors, 24 AWG, polypropyleneinsulationDiameter6.7 mm (0.265 in)ConnectorTitanium, 18.5 mm (0.73 in) O.D.Break strength127 kg (280 lb)Minimum bend radius 2X cable diameter (13.5 mm, 0.54 in)Weight Vented, regular & HF: 14 kg/300 m (32.3lb/1000 ft)Non-vented, regular & HF: 16 kg/300 m(35.6 lb/1000 ft)Vented Tefzel ® : 23kg/300m (52 lb/1000 ft)* Base unit = MP <strong>TROLL</strong> <strong>9500</strong> & factory-installed sensorsFactory-Installed SensorsPressure/levelTypeRangeMedia-isolated piezoresistive siliconstrain gauge15 psig (0-11 m, 0-35 ft)30 psia/psig (0-21 m, 0-69 ft)100 psia/psig (0-70 m, 0-231 ft)300 psia/psig (0-210 m, 0-692 ft)Accuracybetter than ± 0.1% FSResolution1 mmTemperatureTypePlatinum resistance thermometerRange-5°C to 50°C (23°F to 122°F)Accuracy± 0.1°CResolution 0.01°CBarometric pressureTypePiezoresistive silicon pressure sensorRange0-16.5 psia (854 mm Hg, 33.6 in Hg)Accuracy± 0.3% FS (2.54 mm Hg, 0.1 in Hg)Resolution0.1 mm Hg, 0.01 in HgTurbidityType Nephelometer, 90° light scattering, 870nm LED, solid-stateRange0-2000 NTUAccuracy± 5% or 2 NTU (whichever is greater)Resolution0.1 NTUTurbidity WiperPressure Rating 350 psi (246 m, 807 ft)Operating Temp. 0°C to 50°CBasic SensorsConductivityTypeOperating RangeLow Range sensorHigh Range sensorAccuracyLow Range sensorHigh Range sensorResolutionPressure RatingOperating Temp.4-cell conductivity, AC drive5 µS/cm to 20,000 µS/cm150 µS/cm to 112,000 µS/cm± 0.5% or 2 µS/cm (whichever is greater)when calibrated in region of interest.± 0.5% + 2 µS/cm between 150 µS/cmand 112,000 µS/cm when calibrated inregion of interest. From 70 to 150 µS/cm& 112,000 to 200,000 µS/cm ± 2% + 4µS/cm typicalRange-dependent350 psi (246 m, 807 ft)-5°C to 50°C (23°F to 122°F)<strong>TROLL</strong> <strong>9500</strong> Operator’s <strong>Manual</strong> 100095110 rev. 007 01/09
pHTypeRangePressure RatingOperating Temp.AccuracyResolutionpH/ORPTypeGlass sensing bulb, single-junctionelectrode, replaceable ceramic junction,refillable reference electrolyte0 to 12 pH units350 psi 246 m, 807 ft0°C to 50°C (32°F to 122°F)± 0.1 pH unit0.01 pH unitGlass sensing bulb, platinum wire, singlejunctionelectrode, replaceable ceramicjunction, refillable reference electrolyte± 1400 mV, 0 to 12 pH350 psi 246 m, 807 ft0°C to 50°C (32°F to 122°F)± 4 mV, ± 0.1 pH unit1 mV, 0.01 pH unitRangePressure RatingOperating Temp.AccuracyResolutionDissolved Oxygen (polarographic)TypeClark polarographicRange0 to 20 mg/L, 0 to 200% saturationPressure Rating 350 psi (246 m, 807 ft); submersion &retrieval at up to 4 ft per secondOperating Temp. -5°C to 50°C (23°F to 122°F)Accuracy± 0.2 mg/LResolution0.01 mg/LExtended SensorsDissolved Oxygen (optical, RDO)TypeOptical, fluorescence quenchingRange0 to 20 mg/L, 0 to 450% saturationPressure Rating 300 psiOperating Temp. 0°C to 40°C (32°F to 104°F)Accuracy± 0.1 mg/L @ 0-8 mg/L± 0.2 mg/L @ 8-20 mg/LResolution0.01 mg/LBattery typeInstalled sensorsAmmonium (NH 4+)TypeRangePressure RatingOperating Temp.Accuracy ± 10%Resolution0.01 ppmChloride (Cl – )TypeRangePressure RatingOperating Temp.Accuracy ± 15%Resolution0.01 ppmNitrate (NO 3–)TypeRangeTypical Battery Life @ 20°CPressure RatingOperating Temp.Accuracy ± 10%Resolution0.01 ppm2 alkaline D-cellsPressure, temperature, baro, pH/ORP, conductivity, polarographic (Clark) D.O.All of the above plus turbidityAll of the above plus turbidity & wiperPressure, temp., baro, pH/ORP, conductivity, RDO, turbidity2 lithium D-cellsPressure, temperature, baro, pH/ORP, conductivity, RDO, turbidity, no wiperSection 2: Components & FeaturesPVC membrane sensing element, doublejunction Ag/AgCl reference half-cell,reference electrolyte gel0.14 to 14,000 ppm N (0.1 to 18,000 ppmNH 4+)20 psi (14 m, 46 ft)-5°C to 40°C (23°F to 104°F)Solid-state sensing electrode, doublejunction Ag/AgCl reference half-cell,reference electrolyte gel0.35 to 35,500 ppm Cl (2 to 35,000 ppmCl – )100 psi (70 m, 231 ft)-5°C to 50°C (23°F to 122°F)PVC membrane sensing element, doublejunction Ag/AgCl reference half-cell,reference electrolyte gel0.14 to 14,000 ppm N (0.4 to 62,000 ppmNO 3–)20 psi (14 m, 46 ft)-5°C to 40°C (23°F to 104°F)Sample Interval60 min. 15 min.76 days75 days63 days73 days70 days52 days125 days270 days<strong>TROLL</strong> <strong>9500</strong> Operator’s <strong>Manual</strong> 110095110 rev. 007 01/09
Multi-ParameterWater Quality <strong>TROLL</strong> ®3 Getting StartedThis section provides a quick overview of the initial steps necessary toget the Multi-Parameter <strong>TROLL</strong> <strong>9500</strong> ready to take measurements.2. Insert two D-size batteries negative side first, positive side up.You will need—• Power• Sensors• Software• Cable<strong>TROLL</strong> Com communication cable for deployment• Calibration Kit—one for each sensor to be calibrated, or theQuickCal Kit for the Basic Sensor set (pH, ORP, polarographicD.O., Conductivity)Provide PowerTIP: When the unit ships with a Polarographic DissolvedOxygen sensor installed, alkaline batteries are pre-installedin the device to power the D.O. sensor and keep itconditioned.Install batteries in the Multi-Parameter <strong>TROLL</strong> <strong>9500</strong> asfollows:1. Unscrew and remove the battery compartmentcover. Slide it up over the cable (if attached).3. Replace the battery compartment cover and tighten to compressthe o-ring seals.Screw the cover down firmly to compress the o-rings andcreate a waterproof seal. When properly assembled, the o-rings will not be vsible.TIP: The MP <strong>TROLL</strong> <strong>9500</strong> uses standard off-the-shelf 1.5Valkaline D-cells.Alternatively, you may use Saft LSH-20 3.6V lithium D cells.Use of any other lithium battery will void the productwarranty.<strong>TROLL</strong> <strong>9500</strong> Operator’s <strong>Manual</strong> 120095110 rev. 007 01/09
Section 3: Getting StartedInstall SensorsBasic water-quality sensors—pH or pH/ORP, polarographic D.O.,Conductivity—may arrive installed in the instrument’s sensor ports.Proceed to Install Software if there are no additional sensors to beinstalled.Install sensors in the Extended Sensor Set and any sensors shippedseparately as follows:TIP: The RDO ® Optical Dissolved Oxygen sensor hasspecial installation requirements. Please refer to the RDOQuick Start guide, or see Section 13 of this operator’smanual for complete information.1. Remove the restrictor or Cal Cup from the front end of the MP<strong>TROLL</strong> <strong>9500</strong>.Cable Battery compartmentconnector Body RestrictorThis allows access to the sensor block depicted in the drawingbelow.2. Remove the sensor’s protective cap or storage bottle and set asidefor future storage of the sensor. If the connector end is coveredwith a cap, remove it also.3. Remove any moisture or dirt from the area aroundthe port where you will install the sensor, then usethe sensor removal tool to remove the plug from theport. Retain the plug for use when with fewer than 4removable sensors installed.sensorremovaltool4. Remove any moisture or dirt from the port connector with a cleanswab or tissue.5. Check lubrication of the sensor o-rings.The sensor o-rings require generous lubrication beforeinstallation. New sensors will be lubricated at the factory. Ifthe o-rings appear dry, apply a silicone lubricant beforeinstallation.6. Align the mark on the side of the sensor with the mark on the correctport (see diagram), or visually align the sensor connector pinswith the port connector pins.If the sensing element is at the end of the sensor, be carefulto handle the sensor by the sides. Use the insertion tool topress the sensor into the port at step 7.There are four sensor ports, 1 – 4, plus a permanently installedpressure and/or turbidity sensor or plug.End view of sensor block7. Press the sensor firmly into the port until you feel itdock with the connector at the bottom.When the sensor is properly inserted, a small gap (thewidth of the sensor removal tool) remains between theinstrument body and the widest part of the sensor, forease of removal.sensorinsertiontoolD.O. (polarographic)or ammoniumor chlorideor nitratePressure/Turbidity(or plug)ConductivityAfter installing a polarographic D.O. sensor, we recommendconditioning it for 2-4 hours, preferably overnight, beforecalibrating. For more on D.O. sensor conditioning, seeSection 13.RDOor pHor ammoniumor chlorideor nitrateor turbidity wiperpH/ORPor RDOor pHor ammoniumor chlorideor nitrateTemperatureAlignment markEnd view with the RDO cableconnect sensor plugged into ports1 or 3End view with the RDO direct connectsensor plugged into ports 3 andcovering ports 2 and 5.<strong>TROLL</strong> <strong>9500</strong> Operator’s <strong>Manual</strong>13 0095110 rev. 007 01/09
Section 3: Getting StartedInstall the SoftwareWin-Situ 4Install Win-Situ 4 from the In-Situ software CD or the In-Situ website:• Click on Win-Situ 4 and follow the instructions to install Win-Situ 4to your local hard drive.USB <strong>TROLL</strong> Com Drivers• Select the option to install USB <strong>TROLL</strong> Com drivers during theWin-Situ installation. Two drivers will be loaded to your hard drive,(USB <strong>TROLL</strong> Com, USB <strong>TROLL</strong> Com serial port).Pocket-Situ 4For communication using a RuggedReader ® handheld in the field,install the desktop component of Pocket-Situ 4 from the CD or website.The desktop component is the “Win-Situ Software Manager,” andhelps you install Pocket-Situ on the RuggedReader at any time.• Click on Pocket-Situ 4 and follow the instructions to install the Win-Situ Software Manager to your local hard drive.To install Pocket-Situ on the RuggedReader: When convenient, connectthe RuggedReader to the PC, establish a connection in MicrosoftActiveSync ® , launch the Win-Situ Software Manager, and follow theinstructions.Win-Situ SyncIf you plan to synchronize data files from the RuggedReader back to adesktop PC after collecting data in the field, also install Win-Situ Syncfrom the CD or website.Connect the Hardware<strong>TROLL</strong> <strong>9500</strong> to <strong>TROLL</strong> ComConnect the <strong>TROLL</strong> <strong>9500</strong> to the appropriate <strong>TROLL</strong> Com as shown.• Connect a Direct Connect model simply by pressing onto the connectorat the back end of the <strong>TROLL</strong> <strong>9500</strong>.• Attach a Cable Connect model via locking Twist-Lock connector tothe <strong>TROLL</strong>’s RuggedCable—see the box on the next page.<strong>TROLL</strong> Com to ComputerPlug an RS232 <strong>TROLL</strong> Com into a serial port on a desktop/laptop PCor a RuggedReader.Plug a USB into a USB port on a desktop/laptop PC. Install driversand check the virtual COM port—see the box below.After connections are made, you are ready to launch the software andprogram the MP <strong>TROLL</strong> <strong>9500</strong>.RS232 connectionsSerial portDirect Connect<strong>TROLL</strong> ComsUSB connectionsUSB portUSB <strong>TROLL</strong> ComWhen you plug in a USB <strong>TROLL</strong> Com, the USB drivers downloaded duringWin-Situ installation will be installed as follows:• Windows 2000, Windows Vista: When new hardware is detected, thedrivers are installed automatically.• Windows XP: Follow the instructions in the Found New HardwareWizard. Select the option “Install software automatically.”After installation, you will need to determine which COM port the connectedUSB <strong>TROLL</strong> Com is using:Cable Connect <strong>TROLL</strong> Coms• Windows 2000 & Windows XP: Control Panel > System > Hardware >Device Manager > Ports. Click the plus sign to display the ports.• Windows Vista: Control Panel > System > Device Manager (Userpermission required) > Ports. Click the plus sign to display the ports.Remember the COM port number! You will need it when connectingto the <strong>TROLL</strong> <strong>9500</strong> in software.(continued on page 16)<strong>TROLL</strong> <strong>9500</strong> Operator’s <strong>Manual</strong>14 0095110 rev. 007 01/09
Section 3: Getting StartedTwist-Lock Cable ConnectionsRuggedCable mates to the <strong>TROLL</strong> <strong>9500</strong> and to Cable Connect<strong>TROLL</strong> Coms with a bayonet-type Twist-Lock connector.4. Orient the flat sides so they will mate up, and insert the bodyconnector firmly into the cable connector.1. Remove the soft protective caps from the <strong>TROLL</strong> <strong>9500</strong> and thecable.5. Slide the sleeve on the cable toward the body until the pin on thebody pops into the round hole in the slot on the cable.<strong>TROLL</strong> <strong>9500</strong>(or Cable Connect <strong>TROLL</strong> Com)Cable<strong>TROLL</strong> <strong>9500</strong>(or CableConnect<strong>TROLL</strong> Com)TIP: Keep the dust caps to protect the connector pins ando-ring when the connectors are not mated.FlatFlatCable6. Grasp the textured section of the cable connector in one handand the body in the other. Push and twist firmly so that the pinon the body slides along the slot on the cable and locks securelyinto the other hole. The “click” ensures the cable is securelyattached.2. Take a moment to look at the connectors. Each has a flat side.Note the pins on the body connector (one on each side) and thediagonal slots on the cable connector (one on each side).pinslotTo attach a Cable Connect <strong>TROLL</strong> Com, first remove the desiccantfrom the cable (if present): Grasp the textured section of the cableconnector in one hand and the desiccant in the other. Twist in oppositedirections to unlock the desiccant from the cable.Orient the “flats” so they will mate up, and insert the <strong>TROLL</strong> Comconnector firmly into the cable connector.3. Slide back the sleeve on the cable connector.Push, twist, and click to lock.<strong>TROLL</strong> <strong>9500</strong> Operator’s <strong>Manual</strong> 150095110 rev. 007 01/09
Section 3: Getting StartedEstablish Communication with the MP <strong>TROLL</strong><strong>9500</strong>1. Start Win-Situ 4 by double-clicking the shortcut created on thedesktop during installation .Or tap the Pocket-Situ 4 shortcut on the PDA Start Menu.2. The Connection Wizard starts to help you set up the port:• Connection type:• Direct, for use when the Multi-Parameter <strong>TROLL</strong> <strong>9500</strong> isattached directly to the host PC• Modem for a dial-up modem• Spread-Spectrum Radio• Devices connected: Select “one” to speed up connection to asingle device, or “more than one” for a network.• Port: Select the COM port to which the device is attached. Ifusing a USB <strong>TROLL</strong> Com, be sure to select the correct COMport (see the box on page 14). For a Modem connection, enterthe phone number—up to 40 characters; a comma designates apause.• Baud Rate: Select any rate (19,200 is the default); baud ratesare automatically synchronized between devices and the hostPC.• Name (optional): A default connection name is suggested.• To have the wizard connect automatically to the attacheddevice(s), be sure the option Connect and find devices on“Finish” is checked.3. When you finish the Wizard, the software “finds” (connects to) thedevice, and displays it in the Navigation tree.TIP: For an introduction to the appearance and controls ofthe user interface, turn to Section 4, Control Software.Set the Real-Time ClockData collection schedules depend on the device’s real-time clock,shown in the lower right corner of the desktop PC interface. If thedevice clock is wrong, be sure to correct it before scheduling tests.Set the clock as follows:1. With the device selected in the Navigation tree, press Edit.2. In the Device Wizard, select Clock.3. Follow the instructions to synchronize the MP <strong>TROLL</strong> <strong>9500</strong>’s internalreal-time clock to the host computer.4. When you finish the Wizard, Win-Situ sends the information to thedevice and updates the display.TIP: Due to the size of the PDA screen, the device clock isnot displayed in the Pocket-Situ interface. We recommendyou edit the device—Tap the device, tap Edit, tap Clock— tosynchronize the device clock to the PDA clock.Select the deviceSet the clockDevice clockQ:A:What do I do if the MP <strong>TROLL</strong> <strong>9500</strong> does not appear inthe Navigation tree?First try double-clicking the connection. If the device stilldoes not appear, there may be a com mu nication problem.Check these likely culprits:• Be sure you selected the correct COM port for your PC.• Check that all cable connections are tight.• Be sure the MP <strong>TROLL</strong> <strong>9500</strong> has sufficient battery power,or that external power is being supplied.<strong>TROLL</strong> <strong>9500</strong> Operator’s <strong>Manual</strong>16 0095110 rev. 007 01/09
Section 3: Getting StartedQuick-Cal the Basic Water-Quality SensorsYou will need:• MP <strong>TROLL</strong> <strong>9500</strong> with Basic sensors installed (pH or pH/ORP,polarographic D.O., Conductivity), plugs in any unused ports.• Cal Cup. Remove sponge if present.• Quick Cal solution, at room temperature. Shake wellbefore use.1. Fill the Cal Cup with the Quick Cal solution. See guidelinesin the sidebar on this page.2. Remove the restrictor (if attached) and insert the frontend of the MP <strong>TROLL</strong> <strong>9500</strong> into the Cal Cup. Threadthe Cal Cup onto the body until seated against the o-ring, then back off slightly to avoid overtightening.3. Connect the MP <strong>TROLL</strong> <strong>9500</strong> to a PC and establish aconnection in Win-Situ 4 or Pocket-Situ 4.4. Select the MP <strong>TROLL</strong> <strong>9500</strong> in the Navigation tree. The softwarewill automatically detect and display the installed sensors.45. In the Navigation tree, click on Parameters.56. In the Information pane, select QuickCal.62Quick-Cal Tips• A Quick Cal is the fastest way to cali brate pH, conductivity, polarographicD.O., & ORP. But for best results, if your software supports it,we recommend traditional calibration for pH, conductivity, and D.O., asdescribed in Sections 11-13.• Be sure to condition a new polarographic D.O. sensor for 2-4 hours,preferably overnight, before cal i brat ing. See Section 13 for information.If the sensor is installed when you receive the instrument, it is conditionedand ready to calibrate.• Guidelines for filling the Cal Cup with Quick Cal solution:• With a full complement of sensors installed, use the lower line as aguide (about half full).• With 1 or 2 sensors installed, fill to the upper line.• When calibrating a high-range conductivity sensor, insure the sideports are immersed in solution. Dislodge any bubbles that mayappear. For a Quick Cal with a full set of sensors, we suggest you fillthe Cal Cup above the line labeled “Recommended Fill Line - High.”Use about a half-inch of additional fluid, depending on the sensorload. Some experimentation may be needed.• When Quick-Calibrating polarographic D.O. with a high-range conductivitysensor installed, the increased fill level suggests handling withcare when you invert the Cal Cup at step 11—allow the excess fluid tospill into a sink, or remove the Cal Cup from the instrument and poursome fluid out, re-attach the Cal Cup, then invert it and loosen the endcap to achieve the correct atmospheric pressure for a polarographicD.O. calibration. The D.O. sensor membrane should be in air, thetemperature sensor should be completely submerged.• For best accuracy, conductivity sensors should be wetted for 15-30minutes immediately prior to calibration. This immersion can be in eitherclean water or the Quick Cal solution.• For best results at temperatures at or below 15°C, de-select the conductivitysensor when perfoming a Quick-Cal; follow up with a singleparametercalibration uisng 8000 microSiemens/cm.• If an RDO Optical Dissolved Oxygen sensor is installed, use the specialsoft plastic cal insert (it has an orange base) to Quick Cal the standardsensors, since the standard Cal Cup will not fit when the RDO sensoris installed. Fill the cal insert with calibration solution, slide it up aroundthe sensors, including the RDO cable, and use the RDO restrictor as asupport during calibration.• If your MP <strong>TROLL</strong> <strong>9500</strong> includes a turbidity wiper, insure the pad doesnot absorb Quick Cal solution. Either carefully remove the wiper head(see Wiper Maintenance in Section 18), or soak the front end of the<strong>TROLL</strong> in water before calibrating; allow the pad to become saturated.• Quick Cal is not available for these sensors: Nitrate, Ammonium, Chloride,Turbidity, Optical D.O. Traditional calibrations should be performedfor best results from these sensors.<strong>TROLL</strong> <strong>9500</strong> Operator’s <strong>Manual</strong>17 0095110 rev. 007 01/09
Section 3: Getting StartedThe Quick Calibration Wizard starts. A screen like this is displayed.Status indicators during stabilization:NOT TESTED may be displayed before the calibration begins.7UNSTABLE indicates the sensor response does not meet thecriteria for a valid calibration point. All parameters start out at“Unstable” status.NOMINAL indicates the change in the sensor response overtime meets a relaxed stability criterion. “Nominal” stability willoccur first, and can be accepted to shorten the calibration time.STABLE indicates the change in the sensor response over timemeets the stability criteria for a Quick Cal.Reading: Current sensor response (in indicated units).7. Insure there is a check beside the sensors you wish to Quick-Cal.8. Click Next. The pH, ORP, and Conductivity screen appears.8Deviation: Change in response between the last two readings.This enables you to follow the progress of the stabilization, butdeviation from the previous reading is not necessarily the bestindicator of stability as the software is looking at longer-termtrends.Run button: Starts the calibrationAccept button: Becomes available when Nominal stability isreached (see below)Stop button: Stops the current phase of the calibrationBack button: Goes to the previous screen (when available)Next button: Proceeds to the next screen (when available)Cancel button: Cancels the calibration9. Click Run to start the calibration.9The display will continuously update as readings are taken andcompared against the stabilization criteria (see sidebar).All 3 parameters must indicate NOMINAL or STABLE before thecalibration can continue.• When pH, ORP, and conductivity are STABLE, the polarographicD.O. calibration screen is displayed automatically if a polarographicD.O. sensor is installed.Q:A:What is the difference between NOMINAL and STABLE?To meet the criteria for a valid calibration point, the change(deviation) in sensor response is monitored over time. Thesoftware is looking for the calibration solution temperatureand the sensor readings to settle over a specific time period.The criteria for STABLE are designed to meet the publishedspecifications. The NOMINAL criteria are designed toshorten the calibration time when an approximate calibrationis acceptable. When the deviation falls within the limits ofthe “loosened” specifications, NOMINAL is displayed in theStatus area, and the Accept button becomes available tostore the current calibration point.Accepting a NOMINAL value may save considerable time.In some cases, especially if the sensors have been soakingin the solution for several minutes prior to calibration, theaccuracy achieved by accepting a nominal value may bevery similar to that obtained by waiting for complete stability.<strong>TROLL</strong> <strong>9500</strong> Operator’s <strong>Manual</strong>18 0095110 rev. 007 01/09
Section 3: Getting Started• Alternatively, you may click Accept to store the early values. TheAccept button becomes available when NOMINAL or STABLE isindicated for all 3 parameters.• If there is no polarographic D.O. sensor, the Quick Cal is complete.Go to step 14.If performing a Polarographic Dissolved Oxygen calibration,continue with steps 10-13.10. Polarographic Dissolved Oxygen: Before the D.O. segment ofthe Quick Cal Wizard starts, you will be asked how you want tohandle barometric pressure.11. To complete the calibration, expose the polarographicD.O. sensor to air: Without disconnectingthe cable, invert the probe so that themembrane at the tip of the sensor is in air andthe temperature sensor is immersed in fluid.This will probably require you to remove the endcap from the Cal Cup and pour some fluid out.While you have the cap off, remove any dropletson the membrane by blotting gently with aclean swab or the corner of a tissue. Re-attachthe end cap loosely to insure the volume is notpressurized.TIP: For proper venting, loosen the end cap until a smallhole in the threads near the o-ring is at least partly visible.12. In the DO calibration screen, select the membrane type, stampedon the membrane module (if not indicated, select 1-mil Teflon).13. Click Run to begin the stabilization.The display will continuously update as readings are taken andBarometric pressure is important in converting measurement ofD.O. concentration to percent saturation, and a value is requiredfor accurate calibration. If the <strong>TROLL</strong> <strong>9500</strong> cable is vented, anaccurate barometric pressure value can be read from the onboardbarometric pressure sensor. If the <strong>TROLL</strong> cable is non-vented,then a barometric pressure value should be entered manually.12Do one of the following in this screen:• If the <strong>TROLL</strong> <strong>9500</strong> is on vented cable now and will take measurementsusing vented cable, click No — and you may want tocheck the “Don’t ask me this again” box.• If the device is on vented cable now but will take measurementson non-vented cable, click Yes. In the Edit Barometric Channelscreen, check the box indicating non-vented cable for measurementsbut vented cable for calibration/programming.• If the device is on non-vented cable now and will take measurementson non-vented cable, click Yes. In the Edit BarometricChannel screen, check the box indicating non-vented cablefor measurements and enter a barometric pressure value. Forhelp, see Section 9, Monitoring Barometric Pressure.13compared against the stabilization criteria (see sidebar on theprevious page).14. When the sensor response is STABLE (or alternatively, when youaccept the nominal value), the Quick Cal procedure is complete.<strong>TROLL</strong> <strong>9500</strong> Operator’s <strong>Manual</strong>19 0095110 rev. 007 01/09
Section 3: Getting StartedThe Wizard displays a final calibration screen like the one belowat the end of the Quick Calibration procedure. This informationis also stored in the Calibration Report. Click Finish to continue.When you click Finish, the calibration information is written to thesensors.Set Up Custom Pressure/Level MeasurementsYou can configure a pressure channel to display measurements justthe way you want them—as raw pressure head above the sensor, asdepth, or as water level with a reference. The specified settings areeasily changed from one mode to another, and any choice can beredone or undone later, when viewing test data.1. With the MP <strong>TROLL</strong> <strong>9500</strong> connected to a host PC, select the pressureparameter in the Navigation tree.2. Click or tap Edit....1The calibrated sensors are ready to take measurements.Ideally, you chould calibrate just before using the MP <strong>TROLL</strong> <strong>9500</strong>.However, if the the instrument will not be put to use immediately, storeit as follows:• Leave the sensors installed. Remove the Cal Cup and rinse itand the sensors. Add about 50-100 mL of tap water to the CalCup. Return the probe to the Cal Cup for transport to the field.Calibrate the Extended SensorsFor some sensors, the Quick-Cal procedure is not available. A traditionalcalibration is recommended. To calibrate, select the sensor inthe Parameters list and click or tap Calibrate to launch a CalibrationWizard. Complete calibration information is in the following sections ofthis manual:RDO Optical Dissolved Oxygen Section 13 (second part)Ammonium Section 15Chloride Section 16Nitrate Section 17Turbidity Section 182The Parameter Wizard will help you enter the required information.The choices are explained in greater detail in Section 7 below.3. When you finish the Wizard, the information is written to the deviceand the display is updated. The pressure channel is ready to takemeasurementsTIP: For complete information on setting up the pressureparameter, refer to Section 7 of this operator’s manual.<strong>TROLL</strong> <strong>9500</strong> Operator’s <strong>Manual</strong>20 0095110 rev. 007 01/09
Section 3: Getting StartedSet Up to Log Data (Set Up a Test)A “test” is a set of instructions to the instrument’s internal data loggerfor collecting a set of data—including which parameters to measure,how often, and when to start. Section 6 below contains detailed informationon setting up tests.1. With the MP <strong>TROLL</strong> <strong>9500</strong> connected to a host PC, click or tapTests in the Navigation tree.2. Click or tap Add....Complete the SetupIf real-time readings are not required, remove the <strong>TROLL</strong> Com fromthe cable after programming.Protect the “uphole” end of the cable with the cable dust cap or desiccant.The cable dust cap is not waterproof. Be sure it ispositioned above the highest anticipated water level. Avoidareas that may flood.If cable will not be used, attach a Twist-Lock Hanger to the <strong>TROLL</strong><strong>9500</strong>.The instrument is now ready for transport to the site where it will beused to take measurements.12The Test Wizard will help you enter the information. The choicesare discussed in detail in Section 6 below.3. When you finish the Wizard, Win-Situ sends the information to thedevice and updates the display.If you added “scheduled” test (indicated by in the Navigationtree), it will start at its programmed time.If you set up a test or a manual start (indicated by in the Navigationtree), you can start it at any time by pressing the Start buttonwhile connected in software.TIP: For complete information on setting up tests, refer toSection 7 of this operator’s manual.<strong>TROLL</strong> <strong>9500</strong> Operator’s <strong>Manual</strong>21 0095110 rev. 007 01/09
Multi-ParameterWater Quality <strong>TROLL</strong> ®4 Control SoftwareThe interface from a desktop or laptop computer (PC) to the Multi-Parameter<strong>TROLL</strong> <strong>9500</strong> is provided by instrument control software calledWin-Situ ® 4. Instrument control is accomplished through a familiar,easy-to-use Navigation Tree interface.For field use on a hand-held computer (PDA), optional Pocket-Situ 4provides all of Win-Situ’s functionality and features in a convenientfield-portable platform.Use Win-Situ or Pocket-Situ for these tasks:• to calibrate water-quality sensors• to convert pressure measurements to depth or level readings• to set up data collection schedules (“tests”)• to take direct “manual” readings• to take continuous real-time readings (Profiling)• to transfer data from the Multi-Parameter <strong>TROLL</strong> <strong>9500</strong> to thehost computer• to view logged data in text or graph format• to delete data from the Multi-Parameter <strong>TROLL</strong> <strong>9500</strong> in order tofree up memory• to monitor battery and memory usage• to set the device clock• to upgrade device firmware (when available)• to choose measurement units and other custom display options• to monitor indicator water-quality parameters during low-flowpumping• to schedule automatic remote transmissions (if available)TIP: For software system requirements, see Section 2,Components & Features. Software installation is covered inSection 3, Getting Started.Launching the SoftwareWin-Situ 4Use one of the following methods:• Double-click the shortcutinstallation.created on the desktop during• Select Win-Situ 4 from the In-Situ Inc program group on the WindowsStart menu.Pocket-Situ 4Tap Start to display the RuggedReader’s Start Menu. Select Pocket-Situ 4.• If you don’t see a shortcut, tap Programs and select Pocket-Situ 4• If it launches in “demo” mode, you can activate it with the licensekey and activation code from your In-Situ License Agreement<strong>TROLL</strong> <strong>9500</strong> Operator’s <strong>Manual</strong> 220095110 rev. 007 01/09
Section 4: Control SoftwareThe User InterfaceWin-Situ 4 and Pocket-Situ 4 use the familiar “Navigation tree” todisplay your instrument network. The tree appears on the left of thescreen in Win-Situ, and at the top of the screen in Pocket-Situ. Theremainder of the screen is an “Information pane” with details aboutthe “node” you have selected in the tree. The selected node and itsinformation constitute a “view” in the interface.The Win-Situ 4 Application Window (desktop/laptop PC)Navigation treeInformation paneThe Navigation TreeAt the top of the tree is the“Home” site (the hostSiteFlow-Sense WizardData FolderConnectionDeviceParametersTestscomputer). Belowthis is the Flow-Sense Wizard (seeSection 20), then theData Folder containingtests that have beenextracted from the device to the host computer. This is followed byone or more connections (COM ports), and then one or more devices(Multi-Parameter <strong>TROLL</strong>s or other In-Situ instruments) accessiblethrough each COM port. The Device node is further expandable toshow the parameters the device can measure and the tests containedin the device’s memory.The site, wizard, data folder, connection, devices, parameters, andtests are all “nodes” in the Navigation tree. The symbol + means anode can be expanded to show more nodes below it. Each selectionresults in a unique “view” in the Navigation tree.ActionsThe Pocket-Situ 4 Application Window (PDA)NavigationtreeInformationpaneActions<strong>TROLL</strong> <strong>9500</strong> Operator’s <strong>Manual</strong>23 0095110 rev. 007 01/09
Section 4: Control SoftwareSoftware FunctionsConfiguring the PortWhen you start Win-Situ or Pocket-Situ for the first time, a new, emptysite called “Home” is displayed at the top of the Navigation tree. TheConnection Wizard starts automatically to help you add a connectionto the site, specifying your computer’s COM port, desired baud rate,and other port properties.To add a new connection to the site—or if the Connection Wizard doesnot start automatically for some reason—proceed as follows:1. Select the site.2. Click or tap Add....Establishing Communication with the MP <strong>TROLL</strong> <strong>9500</strong>New ConnectionThe last option in the Connection Wizard is to Connect and find deviceson “Finish.” If you select this option, the software will automaticallyestablish communication with the MP <strong>TROLL</strong> <strong>9500</strong>.If you did not select this option, proceed as for an existing connection .Existing ConnectionEach time you launch the software, the site and the connection savedin your last session are displayed in the Navigation tree. To connect:1. Select the connection.2. Click Find. Or just double-click the connection.1122To change the properties of a connection:1. Select the connection.2. Click or tap Edit....Win-Situ or Pocket-Situ will open the connection, synchronize thebaud rate, locate the device, and display it in the Navigation tree.3. Click to select the MP <strong>TROLL</strong> <strong>9500</strong> in the Navigation tree.If the device’s remaining battery capacity is 5% or less, thedevice may not be displayed in the tree. Replace thebatteries before continuing.1Displaying Device InformationTo delete a connection from the site:1. Select the connection.2. Click or tap Delete.For additional information on the port properties prompted by the ConnectionWizard, refer to Section 3, Getting Started.2When you select the MP <strong>TROLL</strong> <strong>9500</strong> in the Navigation tree, the softwarefirst retrieves information about the device, then automaticallydetects the installed sensors and displays them in the tree.TIP: If one or more sensors is incorrectly installed, an errormessage will be displayed. Simply remove the sensor andinstall it in the correct position, then “refresh” the device todisplay the sensors in the Parameters list.With the MP <strong>TROLL</strong> selected in the Navigation tree, the Informationpane displays a wealth of information about the device, as shown inthe Win-Situ screen on the following page. You may need to scroll toview all the information in Pocket-Situ.<strong>TROLL</strong> <strong>9500</strong> Operator’s <strong>Manual</strong>24 0095110 rev. 007 01/09
Section 4: Control SoftwareThe Information pane also provides buttons for actions you canperform, such as upgrading the device features (if available), editingthe device properties (including the real-time clock), and refreshingthe connection.Battery Capacity display: On battery power, the “loaded”battery voltage is reported (i.e., the device is drawing currentfrom the batteries).If external power is detected, an artificially high battery voltage maybe reported depending on the device hardware. Hardware versionsearlier than 3 report a constant, regulated voltage (approximately 3.3V). Hardware version 3 will report the true battery voltage, but sinceswitching to external power removes the load from the battery thenumber may change when you switch from external to battery andvice-versa.Upgrading Firmware and FeaturesFirmware UpgradeNew software releases may include a new version of firmware for theMP <strong>TROLL</strong> <strong>9500</strong>. If the software detects a newer version of firmwarethan that currently loaded in the device, you will be prompted to upgradedevice firmware when you connect to the MP <strong>TROLL</strong> <strong>9500</strong>. Theupgrade process is brief and software-assisted.For best performance, we recommend you upgrade to newfirmware when prompted by the software.TIP: In order for the software to detect it, the new firmwaremust be located in the Firmware folder in the folder whereWin-Situ or Pocket-Situ is installed. Firmware is automaticallycopied to these locations when new software is installed.Features UpgradeThe MP <strong>TROLL</strong> <strong>9500</strong> is available in several models, each offeringa different feature set. Some models may be field-upgraded to takeadvantage of a wider range of features. The field upgrade involveskeying in an upgrade code, issued by In-Situ when an upgrade ispurchased for a specific instrument serial number.If you have an upgradable feature set, the Upgrade button will beavailable in the Information pane when the device is selected in theNavigation tree. If you have purchased a features upgrade for yourMP <strong>TROLL</strong> <strong>9500</strong>, press Upgrade and key in the upgrade code issuedby In-Situ Inc. Follow the instructions in the Upgrade Wizard.Device View of an MP <strong>TROLL</strong> <strong>9500</strong>The device displays its “family,” <strong>TROLL</strong> 9000, in the Navigation treeDevice identificationDate of factory calibrationInstalled sensorsAvailable memoryDevice clockClick “Edit” to set theclock, change the name,or update battery dataBattery informationExternal power indicator (see tip)Time the unit has been “awake”since last battery replacement“Refresh” requeries the device“Upgrade” is active if a featuresupgrade is available<strong>TROLL</strong> <strong>9500</strong> Operator’s <strong>Manual</strong> 250095110 rev. 007 01/09
Section 4: Control SoftwareEditing the Device PropertiesSetting a Device NameThe software recognizes each device on the network by its type andserial number. In addition, you can assign a meaningful description—awell or site name, location coordinates, etc. This name will bedisplayed in the Navigation tree and in the header of test data files.1. With the MP <strong>TROLL</strong> <strong>9500</strong> connected to a host PC and selected inthe Navigation tree, press Edit....2. In the Device Wizard, select Name, then Next.3. Enter a new name for the device (up to 16 characters).4. When you finish the Wizard, the information is sent to the deviceand the display is updated.Setting the Real-Time ClockData collection schedules depend on the device clock, shown in thelower right corner of the desktop PC interface. If the clock is not correct,set it as follows:1. With the MP <strong>TROLL</strong> <strong>9500</strong> connected to a host PC and selected inthe Navigation tree, press Edit....2. In the Device Wizard, select Clock, then Next.3. Follow the instructions to synchronize the MP <strong>TROLL</strong> <strong>9500</strong>’s internalreal-time clock to the host computer.4. When you finish the Wizard, the information is sent to the deviceand the display is updated.TIP: Due to the size of the PDA screen, the device clock is notdisplayed in the interface. We recommend you edit the deviceas above to synchronize the device clock to the PDA clock.Setting Battery InformationAfter replacing the batteries, update the device battery information:1. With the MP <strong>TROLL</strong> <strong>9500</strong> connected to a host PC and selected inthe Navigation tree, press Edit....2. In the Device Wizard, select Battery Information, then Next.3. Select the appropriate battery type and enter the installation date.4. When you finish the Wizard, the information is sent to the deviceand the display is updated.SDI-12 and ASCII Mode PreferencesPreferences for these communication modes may be set in the DeviceWizard.1. With the MP <strong>TROLL</strong> <strong>9500</strong> connected to a host PC and selected inthe Navigation tree, press Edit....2. In the Device Wizard, select the desired mode to edit, then Next.3. Change the settings as appropriate.To communicate via SDI-12, insure SDI-12 is enabled(factory default) in the device. For telemetry applications,SDI-12 should be disabled.Editing the Device Properties211. Select the device in the Navigation tree and click Edit. 2. Select the device property to edit.<strong>TROLL</strong> <strong>9500</strong> Operator’s <strong>Manual</strong> 260095110 rev. 007 01/09
Section 4: Control SoftwareChoosing Measurement Units and Other PreferencesPreferences can be set at any time, and are saved with the site. Aconnection to the instrument is not required.User-selectable preferences include:• Parameter measurement units & elapsed time units• Data file view—report or graph• Calendar date & time of day format• Metric or English units for the Flow-Sense WizardThe following Settings Options are also available:• Start the application in Profiler mode• Specify desired Profiling rate• Re-display the “Don’t Ask Again” dialogsTo display the Preferences window, do one of the following:• In Win-Situ, select Preferences from the Options menu.3. In the bottom of the window, select the unit you want for the highlightedmeasurement. Repeat for as many units as you like.4. Do one of the following:• Click OK to apply the new units and close the window.• Click the Settings tab to change other settings.Other PreferencesTo change other aspects of Win-Situ/Pocket-Situ operation, firstdisplay the Preferences window as above.1. Click the Settings tab.123• In Pocket-Situ:a. Tap the Home site in the Navigationtree...aUnitsb. then tap Setup... in the commandbar.Default units are used for the display of data unless you specify otherpreferences. To set unit preferences, first display the Preferenceswindow as above.1. Select the Units tab.2. In the top of the Units window, select a parameter whose unit youwish to change.b2. Select the options you want:• Start application in Profiler mode. This will take effect at yournext session.• Expand Devices on Find. This will take effect the next time youclick “Find.” The software will automatically display all nodes inthe device tree without any further action from you.• Set desired Profiling rate—the Profiler default rate is 2 seconds,but you may select any rate from 2 to 60 seconds.• Re-display the “Don’t Ask Again” dialogs. This appears if youhave selected “Don’t ask me this again” in any WIn-Situ orPocket-Situ dialog boxes.Boxcar filtering is no longer available.3. Select OK to close the window and apply the settings.12TIP: Preferences are saved with the site (on the PC), not inthe device.3<strong>TROLL</strong> <strong>9500</strong> Operator’s <strong>Manual</strong>27 0095110 rev. 007 01/09
Section 4: Control SoftwareChoosing Pressure Display & Conversion OptionsMeasurements from the optional pressure sensor may be displayedas raw pressure head above the sensor, as depth, or as water levelwith a reference. When measuring depth or level, you have a choiceof methods for conversion from pressure measurements. The specifiedsettings are easily changed from one mode to another, and mostchoices can be redone or undone later, when viewing test data.TIP: For more on the pressure channel setup, refer toSection 7.To set the custom display options and pressure-to-level conversionoptions for a pressure channel:1. With the MP <strong>TROLL</strong> <strong>9500</strong> connected to a host PC and selected inthe Navigation tree, expand the Parameters node and select thepressure parameter.2. Click Edit....Performing Water-Quality CalibrationsAlthough satisfactory results may be achieved in some cases withoutfield-calibrating the water-quality sensors, for best results we recommenda preliminary calibration procedure before the first field use, andperiodic checks and recalibrations as necessary.The software provides several options for sensor calibration. Choosea method based on the time you are willing to spend calibrating andthe accuracy you wish to achieve.• Traditional Calibration guided by software wizards can achieveaccuracy and resolution equivalent to laboratory-based meters.Some sensors require a single-point calibration, some present achoice of single- or multi-point, requiring more than one calibrationstandard.A detailed, step-by-step description of each water quality calibrationmay be found in the relevant parameter section (Sections11-18) of this manual.• Quick Cal calibrates the basic sensors (pH, ORP, polarographicD.O., conductivity) simultaneously to achieve adequate performancewith minimal labor.Refer to Section 3, Getting Started, for the Quick Cal procedure.12The Parameter Wizard starts. Refer to Section 7 for completeinformation on the display and conversion options.3. When you finish the Wizard, the information is sent to the deviceand the display is updated.<strong>TROLL</strong> <strong>9500</strong> Operator’s <strong>Manual</strong>28 0095110 rev. 007 01/09
Section 4: Control SoftwareLogging Data (Adding a Test)Logging data with the MP <strong>TROLL</strong> <strong>9500</strong> is called “running a test.” Totell the instrument how to run the test—which parameters to measure,how often, when to start, etc.—you “add” a test to the device.TIP: For more on logging, extracting, viewing, and deletingdata, refer to Section 6.1. With the MP <strong>TROLL</strong> <strong>9500</strong> connected to a host PC and selected inthe Navigation tree, click or tap Tests.2. Click or tap Add....Taking “<strong>Manual</strong>” ReadingsThe MP <strong>TROLL</strong> <strong>9500</strong> collects data in “tests” but you can get a quick“manual” reading from any device apart from a test, even while a testis running.1. With the MP <strong>TROLL</strong> <strong>9500</strong> connected to a host PC and selected inthe Navigation tree, click or tap Parameters.2. In the Information pane, select one or more parameters to read. Toselect multiple parameters, hold the Control key while selecting.(To display the CTRL key on a PDA, tap the keyboard symbol inthe Command bar.)12123The Test Wizard starts. See Section 6 for a description of the elementsthat constitute a complete test definition.3. When you finish the Wizard, the information is sent to the deviceand the display is updated.3. Click or tap Read.TIP: For continuously updated real-time “manual” readingsof all parameters, select Profiler in the Information pane.Refer to Section 5 for Profiler information.<strong>TROLL</strong> <strong>9500</strong> Operator’s <strong>Manual</strong>29 0095110 rev. 007 01/09
Section 4: Control SoftwareExtracting and Viewing DataLogged data (“tests”) reside in the MP <strong>TROLL</strong> <strong>9500</strong> until you “extract”them. The extract operation copies test data from the device memoryto the host computer. Once a test has been extracted to the hostcomputer, it can be viewed. A test can be extracted and viewed at anytime, even while it or another test is running.To extract a test:TIP: For more on logging, extracting, viewing, and deletingdata, refer to Section 6.1. With the MP <strong>TROLL</strong> <strong>9500</strong> connected to a host PC and selected inthe Navigation tree, expand the Tests node to display all the testsin the device.2. Select a test and click or tap Extract.Exiting the SoftwareWin-Situ 4Select Exit from the File menu.Pocket-Situ 41. Tap the Home site in the Navigationtree...2. then tap Exit in the commandbar.13. To view the test immediately, select the View option at the end ofthe download.TIP: After the test has been extracted to the host computer,it will appear in the Data Folder node in the Navigation tree.A connection to the instrument is not required to view theextracted data.Deleting Data from Instrument MemoryThe Extract operation copies a test data file to the host PC, but doesnot remove it from the MP <strong>TROLL</strong> <strong>9500</strong>. Test data files remain in theMulti-Parameter <strong>TROLL</strong> <strong>9500</strong>’s memory until you delete them. Deletingtests frees up device memory.CAUTION: Be sure to Exit Pocket-Situ as described aboveafter each session. This releases allocated resources usedby Pocket-Situ, assuring that the COM port is available thenext time you connect to the MP <strong>TROLL</strong> <strong>9500</strong>, or to a desktop PCusing ActiveSync.2CAUTION: Be sure to extract data you want to save beforedeleting from the device. Once a test is deleted, the datacannot be retrieved!1. With the MP <strong>TROLL</strong> <strong>9500</strong> connected to a host PC and selected inthe Navigation tree, expand the Tests node to display all the testsin the device.2. Select a test and click Delete.3. Click Yes to confirm your selection.The selected test is deleted and the display is updated.TIP: If a test is running in the device, the Delete button isnot available. You must stop the running test before testscan be deleted. See “Stopping a Test” in Section 6.<strong>TROLL</strong> <strong>9500</strong> Operator’s <strong>Manual</strong>30 0095110 rev. 007 01/09
Multi-ParameterWater Quality <strong>TROLL</strong> ®5 ProfilingAll models of the Multi-Parameter <strong>TROLL</strong> <strong>9500</strong> include a softwarefeature called the Profiler that delivers instant real-time readings onall available channels. Readings are continuously updated as long asthe Profiler is running. This provides a convenient way to characterizesurface waters using a hand-held controller running Pocket-Situ.Profiler Features• Auto detect—the software automatically identifies allproperly connected sensors• Continuously updated readings from all available channels• Optional data logging to the connected PC• Optional start device in Profiler mode• Optional selectable Profiler interval (2-60 seconds)You will need—• MP <strong>TROLL</strong> <strong>9500</strong> with water quality sensors installed andcalibrated• RuggedCable• Cable connect <strong>TROLL</strong> Com (RS232 for RuggedReader)• Laptop PC running Win-Situ 4 or RuggedReader runningPocket-Situ 4Starting the ProfilerTIP: If you set up the software to start in Profiler mode, steps1-4 are done automatically when launching Win-Situ orPocket-Situ. For details on this setting, see ChoosingMeasurement Units and Other Preferences in Section 4.1. Connect the MP <strong>TROLL</strong> <strong>9500</strong> to a host PC and establish communicationin Win-Situ 4 or Pocket-Situ 4.Q:A:Can I do profiling if the MP <strong>TROLL</strong> <strong>9500</strong> is running atest?Yes, but you may need to wait to get a reading if the testmeasurement interval is short. The Profiler will defer to thetest measurement schedule.2. Click to select the MP <strong>TROLL</strong> <strong>9500</strong> in the Navigation tree.The software will automatically detect the installed sensors anddisplay them in the Information pane.If one or more sensors is incorrectly installed, an errormessage will be displayed. Remove the sensor, install it inthe correct position, and refresh the display beforecontinuing.3. Click or tap Parameters in theNavigation tree.4. Click or tap Profiler to start theProfiler.5. You will be asked if you want to set a filename for logged Profilerdata (logging the data is optional)• To use the default name click OK.• To specify another name, key it in5and click OK.• To avoid this question each timeyou start the Profiler, check the option box and click OK.In a moment, each active channel will be read sequentially, and thereadings will be displayed. Up to 8 channels can be shown.TIP: Don’t let the PDA time out while Profiling. To locate thissetting in most PDAs, display the Start menu, selectSettings, System tab, Power.34<strong>TROLL</strong> <strong>9500</strong> Operator’s <strong>Manual</strong> 310095110 rev. 007 01/09
Section 5: ProfilingThe profiler can graph up to 300 readings. A range slider (scroll bar)on the right side of the graph allows you to change the range of visibledata. Like the channel display, the graph will be continuously updated.A range slider at the bottom of the graph lets you zoom in on a narrowertime period.To switch back to the display of active channels, click Meter.Profiling Dissolved Oxygen• Readings are updated approximately every 2 seconds as theProfiler cycles through the available channels in turn.• The currently selected measurement unit is shown below eachreading.TIP: You can use the Setup option to change the Profiler’sreading rate and/or the displayed units. See Customizing theProfiler later in this section for details.• A window without a reading indicates the channel is not available toread, usually because there is no sensor installed in the port.TIP: If a channel you wish to see is not displayed, click the
Section 5: ProfilingSelect a different channel for displayin this positionClick any reading to display agraph of the channelLog next set of readings tothe Data Folder on the PCLog continuously updated readings to theData Folder on the PC. Changes to “StopLog” during continuous logging.Close the Profiler and return to theParameter displayProfiler logging statusDisplay a graph of the data, starting with the first channelY axis range slider.Up to 300 readings (includingthe current reading) can begraphedDouble-click to zoom fully out;double-click again to restoreX axis range sliderAuto-scales the Y axis for theselected range (available forsome channels)Select the channel to graphReturn to the Profiler’schannel displayClose the Profiler and returnto the Parameter view<strong>TROLL</strong> <strong>9500</strong> Operator’s <strong>Manual</strong> 330095110 rev. 007 01/09
Section 5: ProfilingCustomizing the ProfilerChanging the Channels DisplayedThe arrow below each Profiler reading displays a drop-down listthat may be used to assign a different channel to each position, ifdesired. You can use this button to add a channel, such as RDO OpticalDissolved Oxygen, that is not displayed by default. However, only8 channels can be shown.Changing Measurement UnitsClose the Profiler. In Win-Situ, select Preferences on the Optionsmenu. In Pocket-Situ, select the Home site, then tap Setup in thecommand bar.Changing the Sample RateClose the Profiler. In Win-Situ, select Preferences on the Optionsmenu, then select the Settings tab. In Pocket-Situ, select the Homesite, tap Setup in the command bar, then select the Settings tab. Youmay select any sample rate between 2 and 60 seconds.Starting in Profiler ModeIn Win-Situ, select Preferences on the Options menu, then select theSettings tab. In Pocket-Situ, select the Home site, tap Setup in thecommand bar, then select the Settings tab. Check ✔ Start applicationin Profiler mode. This will take effect at your next session (or exit andre-start to apply this setting).Logging Profiler DataProfiler data may be logged to the connected PC while in the “Meter”view.• Snapshot: To log a single set of Profiler readings, click or tap theSnapShot button in the “Meter” view.• Continuous: To log continuous readings, click or tap the Continuousbutton in the “Meter” view. Readings will be logged until youcancel the operation by clicking Stop Log.To Stop LoggingThe Snapshot function logs a single set of readings and stops loggingautomatically.In Continuous mode, click Stop Log. Note that this does not stopProfiling; readings will continue to be updated on the screen.Retrieving Logged Profiler DataIn either Snapshot or Continuous mode, Profiler data are logged tothe connected PC and accessible through the Data Folder. The datamay be retrieved at any time. A connection to the instrument is notnecessary.To retrieve logged Profiler data:1. Expand the Data Folder in the Navigation tree by tapping the +.2. Expand the node for the device type and serial number.3. Look for a data file named with date and time of the profiler reading,and with the ending profiler.bin—or whatever custom name youmay have specified when starting the Profiler.123Logged Profiler dataTIP: The time shown in the filename of a Profiler log is thetime the Profiler started, which may be different from thetime of the first data point logged. Similarly, the ElapsedTime indicated in the Report view of a continuous Profiler log is theelapsed time since the Profiler started.Q:A:Can I see Dissolved Oxygen readings in mg/L and %saturation at the same time?Yes, so long as your preferred unit for DO is mg/L. SelectDissolved Oxygen for one window, and Dissolved Oxygen% Saturation for another window.For additional information on viewing data in the Data Folder, see thesection “Viewing Logged Data” at the end of Section 6 below.Exiting the ProfilerWhen you are ready to exit the Profiler, click Close. The Parametersview will return to the screen.<strong>TROLL</strong> <strong>9500</strong> Operator’s <strong>Manual</strong>34 0095110 rev. 007 01/09
Multi-ParameterWater Quality <strong>TROLL</strong> ®6 Logging DataMemory-equipped Professional models of the MP <strong>TROLL</strong> <strong>9500</strong> areideal for monitoring and recording water quality data. Logging schedulescan be set up in advance, and the collected data stored in thedevice’s storage memory until needed.Collecting a set of data with the instrument is called “running a test.”A “test” is initially a set of user-defined instructions to the logger abouthow to collect the data:• which parameters to measure• how often to measure• when to start taking and logging measurementsAfter it has “run,” the completed test consists of a data file that waslogged following the instructions above.Many of the things you do through Win-Situ or Pocket-Situ controlsoftware can be visualized as actions performed on tests. Forexample,• to give the device instructions for collecting data: add a test.• when you want the device to end data collection: stop a test.• to copy test data from thedevice to a host computer:extract the test.These actions are initiated by buttons in the Information pane whenthe device’s Tests node (group view of all tests) or a Single test isselected in the Navigation tree.Advantages of the Tests node (group view): (1) the Addaction is available, and (2) group operations such as deleteand extract can be performed on multiple tests simultaneously.For illustrations, see the box on page 39.Adding a Test to a Device: The Test WizardThe Add action programs the MP <strong>TROLL</strong> to collect data. The TestWizard starts automatically to help you enter the required information.1. With the MP <strong>TROLL</strong> <strong>9500</strong> connected to a host PC and selected inthe Navigation tree, click or tap Tests.2. Click or tap Add. The Test Wizard starts. The choices are discussedbelow.3. When you finish the Wizard, the information is written to the deviceand the display is updated.To add a test, (1) select theTests node in the Navigationtree, (2) click Add.TIP: Defining a test,setting up a test,adding a test—theseterms all mean the same thingand may be used interchangeablyin this manual.12<strong>TROLL</strong> <strong>9500</strong> Operator’s <strong>Manual</strong> 350095110 rev. 007 01/09
Section 6: Logging DataWith a D.O. sensor installed (polarographic or optical)—Before the Test Wizard starts, you will be asked how you want to handlebarometric pressure. Barometric pressure is important in converting measurementof D.O. concentration to percent saturation. If the <strong>TROLL</strong> <strong>9500</strong>cable is vented, an accurate barometric pressure value can be read fromthe onboard barometric pressure sensor. If the <strong>TROLL</strong> cable is non-vented,then a barometric pressure value should be entered manually.The dialog box shown below asks if you wish to edit the barometric settingsin the absence of vented cable. Do one of the following:• If the <strong>TROLL</strong> <strong>9500</strong> is on vented cable now and will take measurementsusing vented cable, click No — and you may want to check the “Don’task me this again” box.• If the device is on vented cable now but will take measurements usingnon-vented cable, click Yes. In the Edit Barometric Channel screen,check the box indicating non-vented cable for measurements butvented cable for calibration/programming.• If the device is on non-vented cable now and will take measurementson non-vented cable, click Yes. In the Edit Barometric Channel screen,check the box indicating non-vented cable for measurements and entera barometric pressure value. For help in supplying information if thecable is not vented, see Section 9, Monitoring Barometric Pressure.With an RDO ® optical D.O. sensor installed—Before the Test Wizard starts, you will be asked how you want to handlesalinity compensation. The sensor does not react to changes in salinity.To compensate for the lower solubility of oxygen in salty water, a salinityvalue stored in the sensor can be applied. This ensures that the reportedconcentration of dissolved oxygen in the presence of significant watersalinity is accurate. The compensation algorithm is applied internally beforeconcentration is reported by the sensor. Choose one of the following:• Retain Current Setting (shown below).• Use Current Conductivity Reading: If a conductivity sensor is present,you may select the second option. However, the conductivity sensoris subject to fouling, and any conductivity errors thus created will betransmitted to the RDO sensor.• User Input Value: When working in waters with a constant and knownsalinity, and a conductivity sensor is not present, select this option andenter the salinity value (in PSU, Practical Salinity Units). The fixed valueis effective in situations where the salinity variability is low. The valuecan be changed at any time by selecting the RDO sensor in the Navigationtree and clicking “Edit,” then Edit Salinity.Test Setup ParametersA complete test definition has five parts. The choices available in eachscreen are tailored to reflect your selection in earlier screens.1. Test Name (Optional)You may enter up to 16 characters to identify the test. A default nameis proposed. The test name is displayed in the Navigation tree, in thetest data file, and in the filename of tests extracted from the device tothe Data Folder on the host PC.2. Parameters to IncludeAll available parameters are selected by default. De-select anyparameter you do not want to measure during this test by clearing thecheckbox. Remaining choices will be tailored to your selection.The barometric pressure and temperature channels are automaticallyincluded when water-quality channels are selected so that their readingsare available for compensating the measurements.3. Measurement ScheduleThe available schedules depend on your device’s firmware and theparameters selected for inclusion in the test. This list is a quick overview.Additional details are given later in this section.• Linear. All measurements are evenly spaced at a user-specifiedinterval, and all measurements are stored in the device memory.• Event. Measurements are evenly spaced, but you can record an“event” and conserve memory by having the device store onlymeasurements that differ from the previous stored measurementof a designated parameter by a specified amount. Any available<strong>TROLL</strong> <strong>9500</strong> Operator’s <strong>Manual</strong> 360095110 rev. 007 01/09
Section 6: Logging Dataparameter may be selected for event comparisons, and the “delta”or difference amount is prompted in the current basic parameterunit.• Linear Average. This type of test can smooth out anomalous highsand lows that may occur, for example, when a water wave passesover the instrument. Each stored measurement is the average ofseveral rapid measurements.4. Measurement IntervalThe interval specifies how often measurements will be taken duringthis test. Enter any combination of Days, Hours, Minutes, & Seconds.The minimum (fastest) allowable interval depends on your choice ofmeasurement schedule and the parameters included in the test. Formost parameters, the minimum interval is 5 seconds. If RDO OpticalDissolved Oxygen is included, the minimum interval is 10 seconds.5. Start ModeChoose one of the following options for starting this test:• <strong>Manual</strong>. A manual test can be started at any time while the MP<strong>TROLL</strong> <strong>9500</strong> is connected to a PC by pressing the Start button.This mode is useful when you want to synchronize the start of datacollection with an external event like starting a pump.• Scheduled. A scheduled start test will start at the date and timeyou specify. The time proposed by the software is the next hour onthe hour, calculated from the current device time plus 10 minutes.Arrows beside the list boxes may be used to change the start timeand date, or key in the desired start time and date.TIP: In entering the Scheduled Start time, keep in mind thatwhen this test starts, it will stop a running test.The time proposed for a Scheduled start is the next hour onthe hour, calculated from the current device time plus 10minutes. In Pocket-Situ this is your only indication of thedevice time. If the proposed time is wrong, cancel test setup and setthe device clock before scheduling tests.Ending SetupAfter you select the test options and click Finish, the information willbe sent to the device and the new test will appear in the Navigationtree.To let you know which tests can be started with the Start button, thesoftware displays a different symbol for each start type:<strong>Manual</strong> start test (you start)Scheduled start test (starts by itself)More on Measurement SchedulesLinearIn Linear sampling, all selected channels are measured at the sameMeasurement Interval; all measurements are stored in memory.EventAll selected parameters are measured at your chosen MeasurementInterval, but a data point (reading from all active channels) is storedonly if the measurement on the designated “event” channel exceeds auser-defined value. This value is called “Delta” because it relates to achange in the measurement. Here’s how it works:DeltaQ:Where do I enter the stop time for the test?You will not be asked for a stop time because the end of atest cannot be programmed in advance. In most cases, theA: only way to stop data collection is to connect to a PC, selectthe test in the Navigation tree, and press the Stop button.Exceptions: A test stops automatically under these conditions:• when another scheduled test starts.• when the device’s memory is full. In this case the test may indicate“ABEND” (ABnormal END) in the Navigation tree.• if a loss of power occurs. In this case, the test may indicate“ABEND” in the Navigation tree.TIP: If you wish to schedule the end of data collection,try this: Before starting your test, define another test tostart at the time you want the “real” test to stop. Selecta linear test with a long measurement interval—hours or days—and minimal sensors to conserve battery power. Schedule thistest to start at the time you want the “real” test to end. The testwill start at its scheduled time, stopping the earlier test andkicking into a sparse sampling schedule.Each measurement on the selected “event” channel (pressure, forexample) is compared to a reference. The initial reference is taken atthe start of the test. When a pressure measurement varies from thereference by less than the Delta amount, the data point is not stored.When a pressure measurement varies from the reference by morethan the Delta amount, the data point (all channel measurements) isstored. The stored pressure measurement is called a “Delta point” andbecomes the new reference for comparison.In an Event test, then, small and essentially insignificant changes arenot stored, but larger and more significant changes are. This schemewill minimize the size of a data file by storing meaningful data.<strong>TROLL</strong> <strong>9500</strong> Operator’s <strong>Manual</strong> 370095110 rev. 007 01/09
Section 6: Logging DataEVENT (continued)Minimum Delta ValuesSystem accuracy is a function of many variables. It is theoreticallypossible to choose a Delta value so small that random system noise,however slight, might “look” sig nificant. We recommend that you entera reasonable Delta value for the parameter being measured to avoidtriggering an event storage when no event has occurred.Default StorageTIP: Units for the Event channel should be set to the “basic”parameter unit (e.g., psi). Derived (software-calculated) unitsare not available.Consider a situation where there is virtually no change through timein measured value. In this case, it is possible that almost no datawould be stored to the data file. To avoid the possiiblity that a test maycontain little or no stored data, sparse linear sampling also occurswhereby data points are stored to the data file every n measurementsregardless of the measurement comparisons that are occurring. Thistype of data is called “default storage.” For example, if the MeasurementInterval is 10 minutes and you specify a Default storage every 6measurements—as shown in the event test setup screen below—thendata will be logged every hour regardless of the Delta comparisons.Data gathered in an Event test consist of both “Delta points” and“default storage.” There is no distinction made between them in theactual data file since they both represent measurements of the samephysical property (pressure, temperature, conductivity, etc.).Event Test SetupLinear AverageThis type of test can eliminate anomalous highs and lows that may occur—forexample, if a wave passes over the instrument at the time ameasurement is made. For every measurement stored in the data file,the device takes a specified number of mea surements at a specifiedinterval, averages them, and stores the average value.You are prompted forA the storage interval (how often an averaged measurement willbe stored in the data file)B the interval between the rapid measurements that will be averaged(1-255 seconds)C the number of measurements that will be averaged for eachstored measurement (2-99TIP: The storage interval (A) must be at least twice as longas the rapid interval (B) times the number of measurementsfor averaging (C). In the example shown below, 5 seconds x3 = 15) seconds, so the storage interval would have to be at least 30seconds.In the linear average test example shown in the screen below, ameasurement will be logged every hour (A). The logged measurementwill consist of the average of 3 measurements (C) taken 5 secondsapart (B).Linear Average Test SetupMeasurement IntervalEvent channel“Delta” valueDefault storage<strong>TROLL</strong> <strong>9500</strong> Operator’s <strong>Manual</strong> 380095110 rev. 007 01/09
Section 6: Logging DataSingle test view vs. Multiple test viewWhen a single test is selected in the Navigation tree, the Information paneshows details about the selected test.When a test is selected in the Information pane, the Clone... button isavailable to copy the test definition—saves time in setting up tests.When the Tests node (group view) is selected, the Information pane shows alltests and displays the Add... button. #DPs is the number of data points logged.When multiple tests are selected in the Information pane, multiple tests maybe extracted or deleted simultaneously.Other Test OperationsThere are six basic test operations:• Add...—programs the instrument to collect data. See the first partof this section for details.• Edit...—allows you to change the pre-programmed test setupbefore the test runs. Editing a test launches the Test Wizard. Seethe first part of this section for details.• Start—starts the selected test if it has been defined for a manualstart.• Stop—stops a running test.• Extract—copies the selected test data from the instrument to thehost computer. A copy of the data remains in the instrument.• Delete—deletes the selected test from the instrument.• Clone—makes a copy of the selected test definition setup.The operations available depend on the status of the selected test. Adifferent symbol is displayed for each test status:Pending test—manual startCompleted testRunning testPending test—scheduled startABEND test(came to an ABnormal END,e.g., by losing power orfilling the memory)<strong>TROLL</strong> <strong>9500</strong> Operator’s <strong>Manual</strong> 390095110 rev. 007 01/09
Section 6: Logging DataStarting a <strong>Manual</strong> Start Test1. With the MP <strong>TROLL</strong> <strong>9500</strong> connected to a host C, select a pendingmanual test in the Navigation tree.2. Click or tap Start.TIP: If a test is running in the device, the Start button is notavailable. You must stop the running test before you canstart a new one. See “Stopping a Test” below.3. You will be asked to confirm your selection.4. After you confirm, the test starts and the display is updated.Stopping a TestTIP: Once a test starts, the following actions will not beavailable: Add, Delete, Edit (device, parameter, test), Clone,Calibrate.The end of a test cannot be programmed in advance. In most cases,the Stop button is the only way to stop a running test. Exceptions: Atest stops automatically when any of the following occurs:• when another test starts• if the device memory fills up• if power is lost.1. With the MP <strong>TROLL</strong> <strong>9500</strong> connected toa host PC, select a runningtest in the Navigation tree.2. Click or tap Stop. You will be asked to confirm your selection.3. After you confirm, the test stops and the display is updated.Retrieving Logged DataRetrieving, downloading, uploading, transferring—these terms aresometimes used interchangeably to mean the act of copying data fromthe place where it was logged to a host PC. The Extract operation inWin-Situ or Pocket-Situ retrieves test data from the MP <strong>TROLL</strong> <strong>9500</strong>memory and saves it to a file on the host com puter. You may view thefile immediately after the download, or later.Q:A:Where do my extracted data files go?Win-Situ 4 extracts tests to a folder named “Data” in the folderwhere Win-Situ 4 is installed. The file structure looks like this:Win-Situ \ Data \ SN30701 2004-02-12 150000 Test #3.binDevice serial numberTest start date (yyyy-mm-dd)Test start time (hhmmss)Test nameFile typeTIP: On a PDA, the Pocket-Situ \ Data folder is locatedin the device’s non-volatile storage.next page). If a selected test has been extracted previously, onlydata logged since the last download is extracted and is automaticallyappended to the original file.The software presents two options after the extraction:• View launches the data viewer to view the selected file.• Done returns to the Tests view in the software.TIP: The “Extract” operation puts a copy of a test data fileon your PC, but does not delete the test from the device. Tofree up device mem ory, see Deleting Tests, next.TIP: When extracting a large test to a PDA on battery power,avoid letting the PDA time out during the transfer. To locatethis setting in most PDAs, display the Start menu, selectSettings, System tab, Power.1. With the MP <strong>TROLL</strong> <strong>9500</strong> connected to a host PC and selected inthe Navigation tree, click or tap Tests.2. In the Information pane, select one or more tests to extract. Toselect multiple tests, hold the CTRL key while selecting. (To displaythe CTRL key on a PDA, tap the keyboard symbol.)3. Click or tap Extract to extract the test(s).When the extraction is complete, the name(s) and locations of thetest data file(s) on the host computer are displayed (see box on the<strong>TROLL</strong> <strong>9500</strong> Operator’s <strong>Manual</strong> 400095110 rev. 007 01/09
Section 6: Logging DataDeleting TestsTests are stored in the device memory until you delete them. The Deleteoperation permanently removes selected tests from the device,and reorganizes the memory to optimize future data storage. Dependingon how full the memory is, the process may take several minutes.1. With the MP <strong>TROLL</strong> <strong>9500</strong> connected to a host PC and selected inthe Navigation tree, click or tap Tests.2. In the Information pane, select one or more tests to delete. Toselect multiple tests, hold the CTRL key while selecting. (To displaythe CTRL key on a PDA, tap the keyboard symbol in the Commandbar.)Cloning a TestThe Clone function lets you copy all the elements of an existingtest—the test name, selected channels, measurement schedule andinterval—without having to define a new test “from scratch.” You canclone a pending test or a completed test.1. With the MP <strong>TROLL</strong> <strong>9500</strong> connected to a host PC and selected inthe Navigation tree, click or tap Tests.2. In the Information pane, select a test to clone.3. Click or tap Delete. You will be asked to confirm your selection.TIP: If a test is running in the device, the Delete button is notavailable. You must stop the running test before tests can be deleted.See “Stopping a Test” above.4. After you confirm, the selected test(s) are permanently removedfrom the device.123scheduled testTIP: The Delete procedure can be used to cancel a pending3. Click or tap Clone to preview the test definition. The Wizard will stillpresent all the screens, but you can just click Next to get throughthem quickly (or make any changes you want).4. Click Finish to end the wizard. The information will be sent to thedevice and the new test will appear in the Navigation tree.TIP: The proposed start type for a cloned test will always be<strong>Manual</strong>, regardless of the start type of the original test. Thisavoids scheduling a test to start in the past.<strong>TROLL</strong> <strong>9500</strong> Operator’s <strong>Manual</strong> 410095110 rev. 007 01/09
Section 6: Logging DataTransferring Files from a PDA to a DesktopPC4. Right-click the file(s) you want to transfer and select Copy or Cut.Selecting Cut will remove the data file from the PDA.If Win-Situ Sync (or its earlier release, Pocket-Sync 4) is installed onyour desktop PC, file transfer can be done automatically each time thecomputers are connected in ActiveSync.To transfer files “manually” proceed as follows. NOTE THAT MICRO-SOFT ACTIVESYNC IS NEEDED TO CONNECT THE COMPUTERSeven with an In-Situ synchronization utility installed (Win-SituSync or Pocket-Sync 4).TIP: Install Microsoft ActiveSync on the desktop PC beforethe first connection to the PDA. Be sure to exit your lastPocket-Situ session. The following procedure is performedfrom the desktop PC side.1. With the computers connected and ActiveSync running, open upExplore on the ActiveSync tool bar.2. Double-click on “My Pocket PC.”145. Open My Computer or Windows Explorer for the desktop PC andnavigate to the folder where you want to place the data file(s).When the cursor is in the desired folder, right-click, and selectPaste.We recommend placing the files in the following locations to ensurethat they will be displayed properly in the Data Folder branch of theWin-Situ Navigation tree. The In-Situ synchronization utility, if used,will put the files in the proper locations automatically.Test data filesLow flow filesCalibration reportsData folder in the folder where Win-Situ 4 isinstalled (normally, C:\Win-Situ\Data)LowFlow subfolder of the Data folderCalibration Reports folder in the folder whereWin-Situ 4 is installed. These will be accessiblefrom Win-Situ’s Tools menu.23. Browse to the folder where Pocket-Situ Data is stored. On somePDAs this will be in a folder called “Storage Card” or “SD Card.” Onthe RuggedReader, look in Built-in Storage. Open the Pocket-SituData folder (double-click) to display a listing of your extracted data(.bin) files.<strong>TROLL</strong> <strong>9500</strong> Operator’s <strong>Manual</strong> 420095110 rev. 007 01/09
Section 6: Logging DataViewing Logged DataLogged data sets from the Multi-Parameter <strong>TROLL</strong> <strong>9500</strong> are called“tests.” Tests reside in the instrument until you extract them to the hostcomputer. Any test that has been extracted can be viewed in text orgraphical format. A test can be extracted and viewed at any time, evenwhile it or another test is running.2. The Data Folder has a node for data from each device type.<strong>TROLL</strong> <strong>9500</strong> data will be listed under the <strong>TROLL</strong> 9000 “family”device. Click the + beside the <strong>TROLL</strong> 9000 to expand the listing.The software provides two routes to view test data:• If the test is in the instrument’s memory, extract it and select theView option at the end of the download. This launches the dataviewer.2• If the test has been extracted to the host computer, it will appearin the Data Folder node in the Navigation tree. A connection to theinstrument is not required in order to view extracted data.Selecting Data in the Data FolderThe Data Folder appears below the Home site in the Navigation tree.After data files have been extracted from the MP <strong>TROLL</strong> <strong>9500</strong> to theData Folder, the node can be expanded to show device type, serialnumber, and extracted data files.3. Device nodes are further subdivided by serial number. If tests frommultiple <strong>TROLL</strong> <strong>9500</strong>s have been extracted, the serial number ofeach will be displayed. Click the + beside the the serial number ofthe unit whose data you want to view.To view extracted test data:1. Click the + sign beside the Data Folder to expand the listings.314. The serial number node contains the extracted tests and loggedProfiler data. Click to select the test you want to view.4<strong>TROLL</strong> <strong>9500</strong> Operator’s <strong>Manual</strong> 430095110 rev. 007 01/09
Section 6: Logging DataThe selected test is displayed in the Information pane—to the rightof the screen in Win-Situ, or at the bottom in Pocket-Situ.5Win-Situ Graphing ControlsThe Graph button displays data from the first four test channels in graphformat. Time is shown on the X axis in the currently selected unit. Theaxes are auto-ranged. Click any graph to select it for formatting.5456TIP: The data file may appear in Report view or Graph view,depending on the preferences saved in your last Win-Situ orPocket-Situ session.5. To view the test data below the header in Report view:• Use the vertical and horizontal scrollbars to scroll through thedata file.• Or click Full Screen in the shortcut bar to enlarge the text display,and then use the scrollbars.Graphing Data6. Click or tap Graph to display the individual parameter data ingraph format. See the sidebar on this page for Win-Situ graphingcontrols, and on the next page for Pocket-Situ graphing controls.TIP: You can easily switch from Graph view to Report viewand back using the Graph and Report buttons in the Informationpane. However, the view chosen in this way is not“persistent” into your next session. To change the view so it alwayscomes up as Graph or Report, specify the desired Data File View inPreferences (Options Menu) in Win-Situ or Setup in Pocket-Situ.Each graph can display one, two, or all test channels. To change the appearanceand content of any graph, display the Graph menu or right-clicka graph. This provides access to the graph formatting options:• change or add channels• add data point indicators• add grid lines to one or both axes• add a logarithmic time scale• change the range of the Y (data) axis• change the parameter units• add a time stamp to the X (time) axis• zoom in on the graphMany of these options can be set in the Graph settings window:Win-Situ provides a range of options for viewing data in graphformat. Here are some things you may wish to try:• To enlarge the selected graph: Click Full Screen in the toolbar, thengo to the Graph menu and select a different Number of Graphs• To show two channels on the graph: select Graph Settings on theGraph menu, select a Primary channel and a Secondary Channel• To show all channels on the graph: select Graph Settings on theGraph menu, choose All Channels Selected<strong>TROLL</strong> <strong>9500</strong> Operator’s <strong>Manual</strong> 440095110 rev. 007 01/09
Section 6: Logging DataPocket-Situ Graphing ControlsPocket-Situ displays all the test channels in one graph. Time is shown onthe X axis in the currently selected unit. The axes are auto-ranged.The left Y axis represents the first channel in the test (usually temperature),or the first channel selected in the View... option in the commandbar. The right Y axis represents the second channel.Tap Graph or Text in the command bar to change the view.The graph area may be resized as follows:With the stylus (or other suitable pointer), press on the line that separatesthe Navigation tree from the Information pane and drag it up or down toresize the screen.The View... option in the command bar launches wizards to help youchange the way test data are displayed.• Select Channels to View: Tap Next, then tap a check box to showor hide a channel. Tap Finish to return to the graph. The Y axes willreflect your selection.• Change Units and other preferences.• Change Channel Settings: Redefine the display options for a pressurechannel. Refer to Section 7 for details on the settings.Changing the Data DisplayThe View button launches wizards to let you change the way test dataare displayed.• Select Channels to View (Report view): Tap Next, then tap a checkbox to show or hide a channel. Finish returns to the Report view.• Change Units and other preferences.• Change Channel Settings: Redefine the display options for a pressurechannel. Refer to Section 7 for details on the settings.Transferring Data to Excel from Win-Situ 41. Select Report view.2. On the File menu, select Export to Excel. If Microsoft ® Excel ® isproperly installed on your PC, the data file will open in an Excelspreadsheet.Printing Data in Win-Situ 4To print the graph or report as currently displayed:1. Select Graph or Report view as desired.2. On the File menu, select Print graph or Print report.Additional information is available from your printer documentation.Saving Text Files from Win-Situ 41. Select Report view.To resize the graph,drag the dividing linewith the stylus.2. On the File menu, select Save Report.3. In the window that opens, supply a filename in the usual way; thereport will automatically be given a .TXT file type.Switch to text viewSelect channels, change unitsand other preferencesThis graph was created with the following controls: Number of Graphs: OneGraph, All channels selected, Zoomed in on 11-22 minutes, Vertical grid.<strong>TROLL</strong> <strong>9500</strong> Operator’s <strong>Manual</strong> 450095110 rev. 007 01/09
Multi-ParameterWater Quality <strong>TROLL</strong> ®7 Monitoring Pressure (Water Level)Why Monitor Pressure?Water level or pressure head readings are taken for a number ofreasons. In aquifer characterization, this type of data will help the userdetermine important hydrologic parameters of an aquifer, includinghydraulic conductivity, transmissivity, permeability, storage coefficient,dispersivity, and porosity. Some or all of these parameters are importantin the design of wells and well fields for various purposes.In the design of a remediation system, the proper placement of wellsfor monitoring or extraction is of paramount importance if the systemis to function effectively. Accurate data from slug and pump testing isone of the primary tools employed for aquifer characterization in thedesign process.Step testing and constant-rate pump testing yield significant data indetermining proper pumping rates. Improper rates can lead to aquiferdepletion, salt water intrusion, and several other problems. Accuratedata in designing the system and monitoring the system is essentialfor long-term success of the well and the proper maintenance of theaquifer.The collection and use of water level measurements in the miningand coal bed methane industries are essential for the success ofthe mines and wells. Data derived from pilot testing of water wellsconstructed for coal bed methane extraction provide necessaryinformation on bottom-hole pressure and appropriate pumping ratesto accomplish the de-watering necessary to release the methane gas.Monitoring of water levels assures efficient production.Water level measurements ofsurface water by pressuremeasurements yield significantdata about the overall healthof the hydrologic cycle. Thisinformation is also useful to government, agriculture, and industry aswell as the scientific community when planning water use and whenadjudicating water rights issues.The Pressure SensorThe optional pressure sensor of the Multi-Parameter <strong>TROLL</strong> <strong>9500</strong>, ifincluded, is permanently-installed and factory-calibrated. If your MP<strong>TROLL</strong> <strong>9500</strong> was ordered without a pressure or turbidity sensor, therewill be a permanently installed plug in the pressure sensor slot. Apressure sensor can be added at the factory.Pressure sensorDo not try to remove the pressure sensor or permanentlyinstalled plug.Factory CalibrationThe pressure sensor is calibrated across full pressure over a range of-5° to 50°C. The pressure reference is provided by a pressure controland measurement system (PCMS) that supplies a calibrated andcertified pressure to the pressure sensor. The temperature referenceis provided by a water bath with a thermal homogeneity of 0.0008°C and measured with calibrated and certified digital thermometers.The calibration process results in a data set of raw analog to digitalconversions (A/D readings) for both pressure and temperature fromthe device versus actual pressure and actual temperature from thecalibrated references.From a two-dimensional data set of temperatureA/D versus reference temperature,and a three-dimensional data set of pressureA/D versus temperature A/D and referencepressure, numerical coefficients are generatedto equations that map the MP <strong>TROLL</strong>performance across all temperatures andpressures.<strong>TROLL</strong> <strong>9500</strong> Operator’s <strong>Manual</strong> 460095110 rev. 007 01/09
Section 7: Monitoring Pressure (Water Level)Operating PrincipleA pressure transducer senses changes in pressure, measured inforce per square unit of surface area, exerted by a column of wateror other fluid above an internal media-isolated strain gauge. Commonmeasurement units are pounds per square inch (psi) or newtons persquare meter (Pascals).Non-Vented (Absolute) vs. Vented (Gauged) SensorsA non-vented or “absolute” pressure sensor measures all pressureforces detected by the strain gauge, including atmospheric pressure.Its units are psia (pounds per square inch “absolute”), measured withrespect to zero pressure. Absolute pressure sensors are sometimescalled “sealed gauge” sensors.Absolute pressure measurements are useful during vacuum testing, invery deep aquifers where the effects of atmospheric pressure are negligible,and in unconfined aquifers that are open to the atmosphere.With vented or “gauged” pressure sensors, a vent tube in the cableapplies atmospheric pressure to the back of the strain gauge. Thebasic unit for vented measurements is psig (pounds per square inch“gauge”), measured with respect to atmos pheric pressure. PSIG sensorsthus exclude the atmospheric or barometric pressure component.This difference between absolute and gauged measurements may berepresented by a simple equation:Zeroing the Pressure SensorThe following procedure may be used, with caution, to “zero” theoffset of a pressure sensor to correct for electronic drift. The driftedoffset is visible when the sensor is in air and reading other than zero.It is recommended you do not zero the offset if it is outside the specifiedaccuracy of your pressure sensor, as shown in the table below.If the reading in air deviates from zero by more than the amountsshown, you may want to consider a factory recalibration. See the Appendixfor additional information on electronic drift.Sensor Accuracy Acceptable Offsetrange (% full scale) from zero15 psig ± 0.05% FS ± 0.0075 psig30 psig ± 0.05% FS ± 0.015 psig100 psig ± 0.05% FS ± 0.05 psig300 psig ± 0.05% FS ± 0.15 psig1. With the MP <strong>TROLL</strong> connected to a host PC and selected in theNavigation tree, click or tap the Pressure parameter in the Parameterslist.2. Click or tap Calibrate. You will be prompted to ensure the device isin air.P gauge= P absolute- P atmosphereIf your MP <strong>TROLL</strong> <strong>9500</strong> includes a pressure sensor, it is either absoluteor gauged. The pressure sensor type is not software-selectable.However, psia measurements from absolute pressure sensors can bereadily compensated for atmospheric pressure in the software due tothe presence of the MP <strong>TROLL</strong> <strong>9500</strong>’s onboard barometric pressuresensor, as long as the instrument is connected to vented cable. See“Correcting Absolute Pressure Readings for Barometric Pressure”later in this section.Pressure vs. Depth vs. LevelDisplay options for pressure measurements are completely softwareselectable.Pressure sensor data may be displayed as raw pressurehead, as depth, or as water level with a reference. When choosingdepth or level, the software presents additional options for convertingfrom pressure readings (in psi) to depth or level (in feet or meters),including a very accurate conversion that compensates pressurereadings for fluid density, altitude, and latitude.13. When the device is in air, click Yes.The current pressure reading will be set to zero. To check this, take areading with the “Read” button.2<strong>TROLL</strong> <strong>9500</strong> Operator’s <strong>Manual</strong> 470095110 rev. 007 01/09
Section 7: Monitoring Pressure (Water Level)3. Converting Pressure to Depth or LevelThe conversion from pressure in pounds per square inch (psi) todepth or level in meters or feet requires some knowledge of theproperties of the fluid being monitored and optionally of the device’slocation on the earth’s surface.Conversion Using Specific GravityPressure may be adequately converted to feet or meters of fluid usinga dimensionless specific gravity value. A specific gravity of 1.0 (characteristicof pure water at 4°C) is adequate for many ground waterapplications.Conversion Using Density, Latitude, and ElevationPressure in the English unit psi is first converted to the SI unit Pascal(Pa). Conversion from Pascals to meters or feet requires two additionalvalues:• Liquid Density. Pure groundwater at 20°C has a density of 0.998g/cm 3 . A table of density by temperature appears on this page. TheAppendix includes a method to experimentally determine liquiddensity if the working fluid is not pure water.• Gravitational Acceleration. The acceleration due to gravity thatan object experiences is location-specific. Given your latitude andelevation, Win-Situ can calculate a value for gravitational accelerationfor your location.TIP: Either specific gravity or density, latitude & elevationmay be used to convert from pressure (psi) to depth/level(meters or feet ). A gain in accuracy may be realized byselecting the density, latitude & elevation option.4. Level ReferenceIf you selected a level display mode (Surface or Top of Casing), youwill be prompted to enter a level reference. This is a user-specifiedstarting point for level display modes, and can be any value youchoose. Here are some examples:• Surface: If you calculate the water level above mean sea level(MSL) and enter this as the Level Reference, then data will bedisplayed as elevations above MSL.• Top of Casing: If you measure the distance to the water surface(DTW) from the top of the well casing and enter this number as theLevel Reference, then data will be displayed as DTW values.• A Level Reference of 0 is equivalent to “zeroing” the probe. Datawill be displayed as changes, either positive or negative, from thestarting water level.Reference TimeThe MP <strong>TROLL</strong> takes a “snapshot” of the sensor’s raw pressure reading,then your Level Reference is substituted. You can specify that thesnapshot be taken now or when the test starts. The data file will showthe Reference (raw pressure) Reading and when it was taken.• Now: the pressure is measured when you finish setting up thepressure parameter, and the value is stored until the test starts. Allmeasurements taken during the test will be relative to the waterlevel at the time you finished the wizard.• Start of Test: the Reference measurement will be taken at timet=0. All measurements taken during the test will be relative to thewater level at the moment the test starts.TIP: After setting up the pressure channel with the desireddisplay options, select the units you want to see. Use Win-Situ’s Options menu, or Pocket-Situ’s Setup button.Liquid DensityThe conversion from PSI units to meters or feet of fluid requiresseveral conversion factors. One of these is the density (ρ) of theaqueous solution being monitored. Pure groundwater at 20°C has adensity of 0.998 grams per cubic centimeter (g/cm 3 ).Use the values in the table for density if you do not otherwise knowit. However, since these data assume pure water, there is no accommodationfor other variables (such as salinity) that can affectyour actual water conditions. Alternatively, you could compute thefluid density using the procedure given in the Appendix.Fluid density by temperatureTemp. Density Temp. Density Temp. Density(°C) (g/cm 3 ) (°C) (g/cm 3 ) (°C) (g/cm 3 )1 0.999900 11 0.999605 21 0.9979922 0.999941 12 0.999498 22 0.9977703 0.999965 13 0.999377 23 0.9975384 0.999973 14 0.999244 24 0.9972965 0.999965 15 0.999099 25 0.9970446 0.999941 16 0.998943 26 0.9967837 0.999902 17 0.998774 27 0.9965128 0.999849 18 0.998595 28 0.9962329 0.999781 19 0.998405 29 0.99594410 0.999700 20 0.998203 30 0.995646<strong>TROLL</strong> <strong>9500</strong> Operator’s <strong>Manual</strong> 490095110 rev. 007 01/09
Section 7: Monitoring Pressure (Water Level)For DEPTH:Quick Summary of Pressure SetupFor AQUIFER TESTING:1 Select Pressure in Parameters list, select Edit2 Display Mode: Select Depth, click Next.21 Select Pressure in Parameters list, select EditDisplay ModeDepth/Level Conversion Specific Gravity 1.02 Display Mode: Select Level - Top of Casing, click Next.3 Select Depth/Level Conversion: Specific Gravity 1.0. Click Next.4 Select Level Reference 0 & Reference Reading Start of Test.Click Finish.43 Select Depth/Level Conversion: Specific Gravity 1.0.Click Finish.43For surface water monitoring (install probe beforesetting these):Display ModeLevel - SurfaceDepth/Level Conversion Specific Gravity 1.0Level ReferenceCurrent elevation or gaugeheight of water surfaceReference Reading Now (with probe installed)After setting the pressure mode, select the units you want:Win-Situ: Options menu > Preferences, scroll down to Level/Depth, select unit, click OKPocket-Situ: Tap Home at top of screen, tap Setup at bottom of screen, scroll down to Level/Depth, select unit, click OK<strong>TROLL</strong> <strong>9500</strong> Operator’s <strong>Manual</strong> 500095110 rev. 007 01/09
Section 7: Monitoring Pressure (Water Level)Installation for Pressure/Level MeasurementPosition the instrument below the lowest anticipated water level, butnot so low that its range might be exceeded at the highest anticipatedlevel. Lower the MP <strong>TROLL</strong> <strong>9500</strong> gently to the desired depth.If real-time readings are not required, remove the <strong>TROLL</strong> Com fromthe cable after programming. Protect the “uphole” end of the cablewith the dust cap or optional desiccant. If cable will not be used, attacha Twist-Lock Hanger to the <strong>TROLL</strong> <strong>9500</strong>.Securing the CableThe RuggedCable has a handy device called a Kellems® grip nearthe surface end. You can slide it along the cable tothe desired position by compressing it. When youpull on it, it tightens and stops sliding. You may needto pull on both ends of the Kellems grip to properlytighten it and keep it from slipping.Use the loop of the Kellems grip to anchor the cableto a convenient stationary object. It works well withIn-Situ’s “well dock” installation ring. Simply insertthe loop into the locking clip on the well dock, andposition the assembly on the top of a well. Insure thecable is secured to prevent the instrument movingwhile data is being logged.Stabilization TimePressure Sensor Pressure RatingsRange Usable DepthkPa PSI Meters Feet103.4 15 11 35206.8 30 21 69689.5 100 70 2312068 300 210 692Allow the instrument to stabilize to the water conditionsfor about an hour before starting a test. A generousstabilization time is always desirable. Eventhough the cable is shielded, temperature stabilization,stretching, and unkinking can cause apparentKellems gripchanges in the probe reading. If you expect tomonitor water levels to the accuracy of the probe, it’s worth allowingthe extra time for the probe to stabilize to the test environment.Twist-Lock Hanger InstallationsThe non-vented Twist-Lock hanger accessory can beused to suspend a pre-programmed MP <strong>TROLL</strong> <strong>9500</strong>in a well or other site while taking data where barometricpressure changes are not crucial.The Twist-Lock hanger allows use of inexpensivehanging cable, and requires no direct communication and no cableventing. This setup is ideal for use where barometric compensation ofpressure measurements is not required—in vacuum testing, unconfinedaquifers, or very deep applications where barometric pressureeffects are minimal.• Because the Twist-Lock Hanger has no communication capabilities,you must program the MP <strong>TROLL</strong> <strong>9500</strong> before installation• Logged pressure data will show the effects of changes in barometricpressure. However, post-processing tools may be usedto eliminate the effects of barometric pressure changes from thedata, if required. See “Correcting Absolute Pressure Readings forBarometric Pressure” below for more information.Installation Tips for Level/Depth/Pressure Monitoring• Never let a probe “free fall” down a well. The resulting shockwave when it hits the water surface can damage the pressuresensor strain gauge (the “waterhammer” effect), as wellas other sensors.• It is always wise to check the level of water above theprobe, then move it and read again to be sure that the probeis giving a reasonable reading and showing change. It mightnot be located where you think it is — for example, it couldbe wedged against the casing with a loop of cable hangingbelow it. A probe in such a position might become dislodgedand move during the test, giving a false change in level. Asecure placement is critical to accurate level measurements.• When monitoring pressure with vented cable, do not allowthe cable (and its internal vent tube) to kink or bend. If thevent tube is obstructed, water level measurements can beadversely affected. The vent tube can become kinked anddamage the internal components without any visible harm tothe outside of the cable. The recommended minimum bendradius is 63.4 mm (about 2½ in) or more.• Do not position the instrument below the level of the pumpin a pumping well. The pressure transients generated bythe pump will cause false level readings. Large pumps canswallow the probe and cause permanent damage to boththe MP <strong>TROLL</strong> <strong>9500</strong> and the pump.<strong>TROLL</strong> <strong>9500</strong> Operator’s <strong>Manual</strong> 510095110 rev. 007 01/09
Section 7: Monitoring Pressure (Water Level)Correcting Absolute Pressure Readingsfor Barometric PressurePressure measured with an “absolute” or “non-vented” (psia) pressuresensor includes all pressure forces detected by the strain gauge—atmosphericpressure as well as the pressure due to the water column.“Gauged” or “vented” (psig) sensors remove the atmospheric pressurecomponent (pressure due to the atmosphere), so that atmosphericpressure on a water surface is not doubled in the measurements froma sensor under the water surface.Barometric compensation of absolute pressure measurements, ifrequired, may be accomplished in a couple of ways.<strong>Manual</strong> Barometric Pressure CompensationUsing the MP <strong>TROLL</strong>’s Barometric Pressure SensorIf your model of MP <strong>TROLL</strong> <strong>9500</strong> includes an onboard barometricpressure sensor, and the instrument is attached to vented cable, thebarometric pressure sensor output can be used to correct measurementsfrom a submerged absolute (psia) pressure sensor. In thiscase, set up the pressure channel in “pressure head” mode, andselect the same units for both the water pressure channel and thebarometric pressure channel. Set up and run a test that includes bothpressure channels. Extract (download) the data, and subtract thebarometric pressure measurements from the water pressure measurements.Using a Second Unit and a SpreadsheetIf a barometric pressure sensor is not present, and/or the cable is notvented, barometric compensation of absolute pressure measurementsmay be accomplished with the use of a separate device—a Baro<strong>TROLL</strong> or Absolute mini<strong>TROLL</strong>—installed above the water surface,taking barometric pressure measurements. Set up both devices to usethe same units and display mode—the only difference will be if a levelreference is used; in that case the barometric reference should bezero, the downhole reference will be the water level. Schedule tests tostart at the same time in each unit. Extract (download) the data fromboth tests, and subtract the barometric pressure measure ments fromthe water pressure measurements (by hand or in a spreadsheet).Automatic Barometric Pressure CompensationA Baro Wizard in Win-Situ and Pocket-Situ allows for automaticbarometric pressure compensation of absolute pressure data, eitherusing a fixed user-specified value or by reference to a file of barometricpressure data collected at the same time by a Baro<strong>TROLL</strong> orother absolute (psia) instrument installed at the surface. The barometricallycorrected absolute pressure data may be saved in a newfile, if desired.Collecting Barometric Pressure Data for ReferenceBe sure to set the clock in the Baro<strong>TROLL</strong> (or other absoltue instrument).Add a test. Ideally, this test should start before the test in theAbsolute MP <strong>TROLL</strong> <strong>9500</strong> starts and log data on approximately thesame schedule. Run the test. Extract the test (it is not necessary tostop it.)Collecting PSIA DataSet the clock in the Absolute MP <strong>TROLL</strong> <strong>9500</strong>. Add a test and run it asusual. Extract this test also.Using the Baro WizardThe difference in pressure between a Baro<strong>TROLL</strong> at the surface anda submerged MP <strong>TROLL</strong> <strong>9500</strong> with an absolute (psia) pressure sensorcan be calculated from extracted test data files. This task is simplifiedif the Baro<strong>TROLL</strong> test covers the entire duration of the Absoluteinstrument’s test.1. Launch Win-Situ 4 or Pocket-Situ 4. Connection to an instrument isnot necessary after the tests have been extracted.2. In the data folder, select a test extracted from an MP <strong>TROLL</strong> <strong>9500</strong>with an Absolute pressure sensor (PSIA data).3. On the Tools menu, select Baro Wiz.TIP: For additional information on correcting absolutepressure measurements, see the Technical Note “<strong>Manual</strong>Barometric Corrections” in the Downloads section of ourwebsite at www.in-situ.com.<strong>TROLL</strong> <strong>9500</strong> Operator’s <strong>Manual</strong> 520095110 rev. 007 01/09
Section 7: Monitoring Pressure (Water Level)4. In the Barometric Correction window, select the type of correctionto be performed:• None• Value: Enter a barometric pressure value to be subtracted fromall data points in the test file. Units are selectable, and yourentry is checked for validity. For example, in inches of mercurythe valid range is 14.3 to 33.5 (covering altitudes from the Alpsto the Dead Sea). You may not leave this entry blank, becausea fixed value will be needed even with a reference file (next option,see below) in case the time stamps in the two files do notcompletely overlap.• File: Select a test of barometric pressure data collected by aBaro<strong>TROLL</strong> or other PSIA instrument. This becomes the Referencefile from which barometric pressure corrections will bederived. If the time stamps in the files do not overlap completely,the fixed value will be applied.5. To save the corrected data in a new file that will be automaticallynamed, check the create new file checkbox.6. Click OK. The correction is performed immediately and the correctedfile is displayed.Recalibration RecommendationsPressure sensor accuracy can be adversely affected by improper careand handling, lightning strikes and similar surges, exceeding operatingtemperature and pressure limits, physical damage or abuse, as wellas normal drift in the device’s electronic components. Aside from damageto the sensor, the need for factory recalibration is dependent uponthe amount of drift a customer is willing to tolerate. Factory calibrationevery 12-18 months is recommended. Contact In-Situ Customer Servicefor information on the factory maintenance and calibration plan.Calculations of the accuracy drift of the MP <strong>TROLL</strong> <strong>9500</strong> over time arecontained in the Appendix of this manual. Contact In-Situ CustomerService for information on periodic check-ups and re cal ibration.A single fixed correction is appliedto the entire PSIA test file4The content of a reference file ofbarometric pressure data is usedto correct the PSIA test fileWith a check here, the correcteddata is saved in a separate,automatically named file<strong>TROLL</strong> <strong>9500</strong> Operator’s <strong>Manual</strong> 530095110 rev. 007 01/09
Multi-ParameterWater Quality <strong>TROLL</strong> ®8 Monitoring TemperatureWhy Monitor Temperature?Water temperature plays an important role in water chemistry, which inturn influences the biological activity and growth of aquatic organisms.In general, the higher the water temperature, the greater the biologicalactivity and the rate of chemical reactions. An important example ofthe effects of temperature on water chemistry is its impact on oxygen.Warm water holds less oxygen than cool water; the maximum amountof oxygen that can be dissolved in the water decreases as watertemperature increases.Artificially high temperatures are often referred to as “thermal pollution,”which may result from discharge of municipal or industrialeffluents. Thermal pollution can have a significant ecological impact.In running waters, particularly small urban streams, elevated temperaturesfrom road and parking lot runoff can be a serious problem forpopulations of cool or cold-water fish.Changes in the growth rates of cold-blooded aquatic organisms andmany biochemical reaction rates can often be approximated by the“Q 10rule,” which predicts that growth rate will double if temperatureincreases by 10°C (18°F) within their “preferred” range.End view of sensor blockKnowledge of water temperature is essential to the measurement ofdissolved oxygen, conductivity (salinity), pH, and many other waterqualityparameters. In limnological studies, water temperature as afunction of depth can be an important indicator. Industrial plants oftenrequire data on water temperature for process use or heat-transmissioncalculations.These are only a few of many reasons for measuring and recordingwater temperature over the short or long term.The Temperature SensorAll models of the Multi-Parameter <strong>TROLL</strong> <strong>9500</strong> include a permanentlyinstalled, factory-calibrated sensor for measuring solution temperature.Do not try to remove the permanently installedtemperature sensor.The MP <strong>TROLL</strong> <strong>9500</strong> temperature sensor is the Standard PlatinumResistance Thermometer specified by the ITS-90 (International TemperatureScale of 1990). A platinum resistance thermometer (PRT) isa type of resistance temperature detector (RTD).TIP: After a drop or shock, if the end of the temperaturesensor is slightly bent, it may be carefully bent by hand (notools, please!) back to its original alignment. Note that asevere shock may affect the accuracy of the temperature sensor.Pressure/Turbidityor plugPlatinum Resistance ThermometerTemperature<strong>TROLL</strong> <strong>9500</strong> Operator’s <strong>Manual</strong> 540095110 rev. 007 01/09
Section 8: Monitoring TemperatureRole of the Sensor in CalibrationThe temperature sensor has a primary function during calibration oftemperature-dependent water-quality parameters such as conductivity.When the calibration temperature is known, temperature compensationcan be provided during measurement of water-quality parameters.The temperature sensor also provides continuously updatedreal-time measurements of solution temperature when profiling.Ensure that the temperature sensor is immersed in at least one-halfinch of solution during calibration of all parameters. The fill line on theCal Cup serves as a guide to the recommended quantity of calibrationsolution.For best results, the water-quality sensors should be calibrated at thesame temperature that will be encountered in the field.Software FunctionsConversion of resistance (measured by the PRT) to temperature isautomatic in the software. No user calibration is required.ReferencesEaton, A.D., L.S. Clesceri, E.W. Rice, and A.E. Greenberg, eds.,Standard Methods for the Examination of Water and Wastewater,21st edition, Washington, D.C.: American Public Health Association,American Water Works Association, and Water EnvironmentFederation, 2005. Section 2550, Temperature.EPA, Methods for Chemical Analysis of Water and Wastes,EPA/600/4-79-020, revised March 1983. Method 170.1, Temperature,Thermometric. Approved at 40 CFR Part 136.Mangum, B.W., and G.T. Furukawa, Guidelines for Realizing the ITS-90, NIST Technical Note 1265, U.S. Department of Commerce,1990.Water on the Web (WOW). University of Minnesota project initiallyfunded by the National Science Foundation. On the web at wow.nrri.umn.edu.The temperature channel is automatically included in tests so thatsolution temperature is available to compensate water-quality datafrom other channels.UnitsTemperature may be displayed in degrees Celsius (°C) or degreesFahrenheit (°F).TIP: To change unit preferences: In Win-Situ, selectPreferences on the Options menu. In Pocket-Situ, select theHome site, then tap Setup in the command bar.<strong>TROLL</strong> <strong>9500</strong> Operator’s <strong>Manual</strong> 550095110 rev. 007 01/09
Multi-ParameterWater Quality <strong>TROLL</strong> ®9 Monitoring Barometric PressureWhat is Barometric Pressure?Barometric, or atmospheric, pressure is the force exerted by thegases in the atmosphere everywhere on the surface of the earth.Barometric pressure is greatest at or below sea level, and decreasesas altitude above sea level increases.Why Monitor Barometric Pressure?Barometric pressure influences the measurement of water levels inwater bodies that are open to the atmosphere. It also determines theamount of atmospheric gases that can be dissolved in water; moreoxygen, for example, can be dissolved in water at higher barometricpressure (lower altitude). Barometric pressure additionally influencesother water-quality parameters such as pH.A logged record of barometric pressure data during a test can be usedto correct water level measurements made with an absolute pressuresensor to factor out the effects of barometric pressure fluctuations.To measure barometric pressure, the probe must be ventedto the atmosphere. A submerged Multi-Parameter <strong>TROLL</strong>on non-vented cable cannot accurately report barometric pressure.If your MP <strong>TROLL</strong> <strong>9500</strong> is used with a non-vented backshell and/ornon-vented cable, a software correction can substitute for barometricpressure venting. See the procedure in this section.The Barometric Pressure SensorMost models of the Multi-Parameter <strong>TROLL</strong> <strong>9500</strong> include a permanent,factory-calibrated internal barometric pressure sensor. Itsprimary function is in calibration and measurement of water-qualityparameters, such as dissolved oxygen, that are dependent upon barometricpressure. It may also be used to compensate fluid pressuremeasurements made with an absolute pressure sensor.The sensor is automatically included in tests so that its value is availableto compensate water-quality data from other channels.UnitsThe following units are available for barometric pressure: Bars, milliBars,inches of mercury (in. Hg or “ Hg), millimeters of mercury (mmHg), cm, pounds per square inch (psi)TIP: To change unit preferences: In Win-Situ, selectPreferences on the Options menu. In Pocket-Situ, select theHome site, then tap Setup in the command bar.Collecting Accurate Measurements withoutVented CableWin-Situ and Pocket-Situ cannot determine whether the MP <strong>TROLL</strong><strong>9500</strong> is on vented or non-vented cable. However, you can supply thesoftware with this information, and also enter a fixed barometric pressurevalue to be used in the absence of cable venting.Procedure:1. Select the barometric channel in the Navigation tree.122. Click or tap Edit.... The Edit Barometric Channel screen appears.Several options are presented:TIP: This screen can also be accessed during test setup anddissolved oxygen calibration.<strong>TROLL</strong> <strong>9500</strong> Operator’s <strong>Manual</strong> 560095110 rev. 007 01/09
Section 9: Monitoring Barometric Pressure3. Do one of the following:• If this MP <strong>TROLL</strong> <strong>9500</strong> has a barometric pressure sensor andvented cable, select “Use vented cable.” Go to step 5.• If the device is on non-vented cable now and will take measurementsusing non-vented cable, select “Use non-ventedcable or backshell.” Continue to step 4.• If the <strong>TROLL</strong> is on vented cable now but will take measurementson non-vented cable, select “Use non-vented cableor backshell” and also check the last box so a reading can betaken from the barometric pressure sensor while it is available.4. Supply a barometric pressure value for the software to use in theabsence of vented cable. Choose one of these options:• Supply a fixed pressure value in your choice of units (selectunits by clicking the arrow on the list box). This value will beused each time barometric pressure is required elsewhere in thesoftware—for example, when calibrating dissolved oxygen.• Enter your elevation and let the software calculate barometricpressure based on the values in the table on this page. Pleasenote that this fixed value will not be recalculated if the elevationchanges.5. Click OK to store this information.Conversionsbars ∗ 29.530 = inches of mercurypsi ∗ 2.036 = inches of mercuryatmosphere ∗ 101325 = Pascalspsi ∗ 6.894757 ∗ 10 3 = Pascalsbars ∗ 14.50337 = psi345Pressure vs. Elevation(based on U.S. Standard Atmosphere)ElevationPressureft m in. Hg mm Hg PSI Bars-1,000 -304.8 31.02 787.9 15.25 1.051- 500 -152.4 30.47 773.8 14.94 1.0300 0 29.92 760.0 14.70 1.013500 152.4 29.38 746.4 14.43 0.9951,000 304.8 28.86 732.9 14.18 0.9771,500 457.2 28.33 719.7 13.90 0.9582,000 609.6 27.82 706.6 13.67 0.9422,500 762 27.31 693.8 13.41 0.9243,000 914.4 26.81 681.1 13.19 0.9093,500 1066.8 26.32 668.6 12.92 0.8914,000 1219.2 25.84 656.3 12.70 0.8754,500 1371.6 25.36 644.2 12.45 0.8585,000 1524 24.89 632.3 12.23 0.8435,500 1676.4 24.43 620.6 12.00 0.8276,000 1828.9 23.98 609.0 11.77 0.8116,500 1981.2 23.53 597.6 11.56 0.7967,000 2133.6 23.09 586.4 11.34 0.7817,500 2286 22.65 575.3 11.12 0.7668,000 2438 22.22 564.4 10.90 0.7518,500 2590.8 21.80 553.7 10.70 0.7379,000 2743.2 21.38 543.2 10.50 0.7239,500 2895.6 20.98 532.8 10.30 0.71010,000 3048 20.58 522.6 10.10 0.69610,500 3200.4 20.18 512.5 9.91 0.69211,000 3352.8 19.79 502.6 9.73 0.67011,500 3505.2 19.40 492.8 9.53 0.65712,000 3657.6 19.03 483.3 9.35 0.64412,500 3810 18.65 473.8 9.15 0.63113,000 3962.4 18.29 464.5 8.97 0.61813,500 4114.8 17.93 455.4 8.81 0.60714,000 4267.2 17.57 446.4 8.63 0.59514,500 4419.6 17.22 437.5 8.46 0.58315,000 4572 16.88 428.8 8.28 0.57115,500 4724.4 16.54 420.2 8.13 0.56016,000 4876.8 16.21 411.8 7.96 0.54916,500 5029.2 15.89 403.5 7.81 0.538<strong>TROLL</strong> <strong>9500</strong> Operator’s <strong>Manual</strong> 570095110 rev. 007 01/09
Multi-ParameterWater Quality <strong>TROLL</strong> ®10 Monitoring Water Quality: OverviewWhy Monitor Water Quality?At a time of increasing demands on the finite natural resources of ourplanet, public organizations and private individuals alike have becomeacutely aware of the responsibility to maintain the quality of the earth’sair and water supplies.Recent rapid advances in knowledge and technology have made itpossible to deliver accurate, timely, and reliable data on processeswe cannot necessarily examine visually. New-generation sensors forin-situ measurement of surface waters and groundwater can be anefficient alternative to time- and labor-intensive programs of field samplingand transportation to a laboratory for analysis, or can supplementsuch programs. If it is possible to collect, interpret, and respondin a timely fashion to accurate information about water supplies andwater quality, we can design better systems for protection of thosesupplies.Monitoring water-quality parameters can reveal much about thepresence and movement of natural and unnatural components ofwater—the presence of harmful bacteria, potential pollution sources,depletion of nutrient requirements for aquatic life, salt-water intrusioninto fresh water bodies, changes in water level or temperature thatcan alert observers to the onset of an “event” that can adversely affectthe quality of the resource.Monitoring water quality in surface and groundwater resources maybe required by Federal, state, or local regulations. Digital records ofmonitoring can document compliance with guidelines and standardsmandated by regulatory bodies.Profiling and logging water-quality data can provide timely informationon continually changing conditions—profiling to provide instantaneousreal-time feedback, logging to track trends and demonstrate compliance.The SensorsThe Multi-Parameter <strong>TROLL</strong> <strong>9500</strong> takes advantage of new technologiesto monitor water-quality parameters in-situ with high accuracy.Each sensor has been manufactured to our rigid specifications and isdesigned to operate with the entire suite of sensors and with the MP<strong>TROLL</strong> <strong>9500</strong> electronics. These “smart” sensors retain serial numberidentification and calibration information, and are detected and identifiedby the instrument. A sensor may be calibrated in any MP <strong>TROLL</strong><strong>9500</strong> and moved to another port that accepts the sensor type, or usedin another MP <strong>TROLL</strong> <strong>9500</strong>, without recalibration. The most accurateresults will be obtained when a sensor is calibrated and operated inthe same MP <strong>TROLL</strong> <strong>9500</strong>.The water quality sensors available for the Multi-Parameter <strong>TROLL</strong><strong>9500</strong> may be classed in two general types:Basic Sensor Set• pH• Combination pH/ORP (Oxidation-Reduction Potential)• Dissolved Oxygen, polarographic (DO)• Conductivity (and Specific Conductance, Salinity, TotalDissolved Solids, Resistivity)The pH sensor is a Single ISEs (ion-selective electrode). The CombinationpH/ORP sensor is a Multiple ISE.The Basic sensors can be factory-calibrated and pre-installed in theMP <strong>TROLL</strong> <strong>9500</strong>. They are ready for use right out of the box with abrief Quick Cal. However, for best results, if your software supportsit, we recommend that you perform a traditional two-point calibrationfor pH and DO, and a specific range calibration for conductivity asdescribed in sections 11-13 below. The accuracy that can be achievedfrom the instrument is proportional to the time and care you put intocalibration.<strong>TROLL</strong> <strong>9500</strong> Operator’s <strong>Manual</strong> 580095110 rev. 007 01/09
Section 10: Monitoring Water Quality: OverviewExtended Sensor SetThe Extended Sensor set includes:• Ammonium• Chloride• Nitrate• Turbidity (factory-installed)• RDO ® Optical Dissolved OxygenInstalling SensorsThe diagram below represents a head-on view of the “sensor block”in the front end of the MP <strong>TROLL</strong> <strong>9500</strong>. There are four sensor ports,plus permanently installed pressure and/or turbidity and temperaturesensors. Pressure and turbidity sensors are optional—if your instrumentdoes not include one or both of these sensors, there will be apermanently installed plug in the port.Do not try to remove the pressure or turbidity sensor orpermanently installed plug.Although the sensor design permits any sensor to install into anysensor port without damage to either the sensor or the instrument,for proper functioning please insure that sensors are installed in theirintended ports, as shown in the diagram.To install sensors:1. Remove the restrictor or Cal Cup from the front end of the MP<strong>TROLL</strong> <strong>9500</strong>. This allows access to the sensor block shown below.End view of sensor blockQ:A:Will a sensor work if installed in the wrong port?Physically, a sensor may be plugged into any port. However,a sensor that is detected in the wrong port for its type willgenerate an error message in the software. The messagewill let you know which port or ports the incorrectly installedsensor should be moved to.In this case, remove the offending sensor and install it in thecorrect port. Then “refresh” the device view in the softwareto update the display.2. Remove the cap or storage bottle from the sensor. Retain the capor bottle for future storage and protection of the sensor. If the connectorend is covered with a cap, remove it also.TIP: To ensure optimum membrane response for new ionselectiveelectrodes (pH, ORP, nitrate, ammonium, chloride),soak the sensor in calibration solution for at least 15 minutesand up to several days before calibration.3. Remove any moisture or dirt from the area aroundthe port where you will install the sensor, then use thesensor removal tool to remove the plug from the port.Retain the plug for use with fewer than 4 removablesensors installed.TIP: If you are installing a sensor in port 3 (the central port),install it first. This will make it easier to install sensors inother ports.sensorremovaltool4. Remove any moisture or debris from the connector in the bottom ofthe port with a clean swab or tissue.5. Check lubrication of the sensor o-rings.D.O. (polarographic)or ammoniumor chlorideor nitratePressure/Turbidity(or plug)ConductivityThe sensor o-rings require generous lubrication beforeinstallation. New sensors will be lubricated at the factory. Ifthe o-rings appear dry, apply a silicone lubricant beforeinstallation.RDOor pHor ammoniumor chlorideor nitrateor turbidity wiperpH/ORPor RDOor pHor ammoniumor chlorideor nitrateTemperaturealignment mark6. Align the mark on the sensor with the alignment mark on the correctport (see diagram), or visually align the sensor connector pinswith the port connector pins.7. Press the sensor firmly into the port until it is securelyseated. When properly inserted a small gap (width ofthe sensor removal tool) remains between the instrumentbody and the widest part of the sensor, for easeof removal.sensorinsertiontool<strong>TROLL</strong> <strong>9500</strong> Operator’s <strong>Manual</strong> 590095110 rev. 007 01/09
Section 10: Monitoring Water Quality: OverviewRemoving SensorsSensors may be removed for inspection, cleaning, routine maintenance,and storage. Because the smart sensors retain calibrationinformation, they may be removed and re-installed—even in anotherMP <strong>TROLL</strong> <strong>9500</strong>— as often as necessary.Remove a sensor by positioning the yoke of the sensorremoval tool at the point where the sensor enters thesensor block. Firmly pry the sensor upward until it popsout.Sensor O-RingssensorremovaltoolTwo Viton® o-rings on each sensor provide a watertight seal againstwater leakage into the instrument body. We recommend that youinspect these o-rings each time you remove or install a sensor. Checkcarefully for cracks, tears, splitting, shredding, and other damage. Ifthe o-rings are in good condition, apply silicone lubricant before installingthe sensor again. Remove excess lubricant with a tissue, andtake care to keep grease away from the area around the connector atthe bottom of the sensor. Should lubricant get into this area, it can beremoved with a clean cotton swab.If the o-rings become damaged to the extent that no longer provide aneffective seal, they should be replaced. Sensor o-rings and lubricantare available from In-Situ Inc. or your distributor.Calibration OverviewThe MP <strong>TROLL</strong> <strong>9500</strong> and its control software provide several optionsfor calibration of the water-quality sensors. Select the method thatsuits the time you have at your disposal and the degree of accuracyyou want to achieve when measuring water-quality parameters.Satisfactory results may be achieved using the Quick Cal procedure.Some sensors can even return nominal results straight out of the boxusing the factory-supplied default calibration coefficients. However,for best results we recommend a full traditional calibration procedurebefore the first field use, and periodic checks and recalibrations asnecessary thereafter.The following available options are briefly described in the next twopages:• Traditional Calibration• Quick Calibration• Out-of-Box• Factory DefaultsTraditional CalibrationA full traditional calibration, guided by software wizards, can achievethe highest level of accuracy. Some sensors require a single-pointcalibration, others present a choice of single- or multi-point, requiringmore than one calibration standard. A single-point calibrationgives good results in the range of values represented by the selectedcalibration solution. When a wide range of values are expected, amulti-point calibration is recommended.With the sensor installed in the MP <strong>TROLL</strong> 9000 and immersed incalibration solution, the sensor is powered at regular intervals andits response is monitored. The difference (deviation) between theminimum and maximum response over a predetermined time periodis tracked by the software. When the peaks of the response fall withinpredetermined limits for the time period, the sensor response isconsidered sufficiently stable to provide a valid calibration point. Thelength of time and allowable deviation are specific to each sensortype, and furthermore are specific to the determination of nominalstability or complete stability. The time period of interest is shorter fornominal stability than for complete stability, allowing for a shorteningof the calibration soak time while still returning a valid calibration point.• Available for: All water-quality parameters.• Requirements: MP <strong>TROLL</strong> <strong>9500</strong>, sensors (installed), Cal Cup,and one or more calibration solutions for each parameter to becalibrated. Suitable calibration solutions are supplied in In-Situ’sindividual calibration kits.• Where to find the method in this manual: Sections 11-19.Q:A:What is the difference between NOMINAL and STABLE?To meet the criteria for a valid calibration point, the change(deviation) in sensor response is monitored over time. Thesoftware is looking for the calibration solution temperatureand the sensor readings to settle over a specific time period.The criteria for STABLE are designed to meet the publishedspecifications. The NOMINAL criteria are designed toshorten the calibration time when an approximate calibrationis acceptable. When the deviation falls within the limits ofthe “loosened” specifications, NOMINAL is displayed in theStatus area, and the Accept button becomes available tostore the current calibration point.Accepting a NOMINAL value may save considerable time.In some cases, especially if the sensors have been soakingin the solution for several minutes prior to calibration, theaccuracy achieved by accepting a nominal value may bevery similar to that obtained by waiting for complete stability.<strong>TROLL</strong> <strong>9500</strong> Operator’s <strong>Manual</strong> 600095110 rev. 007 01/09
Section 10: Monitoring Water Quality: OverviewQuick CalibrationA “Quick Cal” calibrates the Basic sensors simultaneously to achieveadequate performance with minimal labor using a single “universal”calibration solution.• Available for: pH, ORP, polarographic Dissolved Oxygen, andConductivity.• Requirements: MP <strong>TROLL</strong> <strong>9500</strong>, sensors (installed), Cal Cup,and Quick Cal solution.• Where to find the method in this manual: Section 3, GettingStarted.Out of the BoxSome sensors may be installed and used right out of the box usingfactory-supplied default calibration coefficients.• Available for: pH, ORP, and Conductivity.• Requirements: MP <strong>TROLL</strong> <strong>9500</strong>, sensors (installed).• Where to find the method in this manual: No method required,plug-and-play.Default CoefficientsThis option resets the sensor’s factory defaults and is best when thesensor is new.• Available for: pH, ORP, and Turbidity.• Where to find the method in this manual: See pH calibration inSection 11, ORP calibration in Section 14, Turbidity calibration inSection 18.The cell constant for a conductivity sensor may be entered “by hand,”without performing a complete calibration, if desired. See the procedurein Section 12 below.Preparing to CalibrateCalibration KitsKits of calibration solutions for various parameters and ranges areavailable from In-Situ Inc. Our calibration solutions are certified toN.I.S.T. standards, packaged in quarts, each providing sufficientfluid for at least 6 calibrations. Kits include deionized water if thatsubstance is recommended for rinsing a particular sensor duringcalibration.The Quick Cal kit provides a convenient “universal” calibration solution,designed to calibrate multiple parameters simultaneously.The Calibration CupThe clear acrylic Cal Cup shipped with your MP <strong>TROLL</strong> <strong>9500</strong> isused to hold solution during sensor calibration. When fitted with asmall moist sponge, it also provides a convenient way to protect andhydrate the sensors of the MP <strong>TROLL</strong> <strong>9500</strong> between uses.The base of the Cal Cup is removable so that the stirrer may beattached for calibrations where continuous agitation of the solution isrecommended. A small hole in the threads of the base near the o-ringpermits venting during 100% dissolved oxygen calibration with the CalCup and probe inverted.The Cal Cup’s fill lines indicate the recommended amount ofsolution for most calibrations, and ensures the temperaturesensor is immersed.• With a full complement of sensors installed, use thelower line as a guide.• With only 1 or 2 removable sensors installed, fill to theupper line.The temperature sensor should always be immersed in atleast one-half inch of fluid.CALCupBaseTIP: When using Pocket-Situ to perform calibrations, do notlet the PDA time out during the procedure. To locate thissetting in most PDAs, display the Start menu, selectSettings, System tab, Power.When attaching the Cal Cup to the front end of the MP <strong>TROLL</strong> <strong>9500</strong>,align carefully and thread the Cal Cup onto the body until seatedagainst the o-ring, then back off slightly to avoid overtightening.When attaching the Cal Cup to the instrument body, becareful not to overtighten.<strong>TROLL</strong> <strong>9500</strong> Operator’s <strong>Manual</strong> 610095110 rev. 007 01/09
Section 10: Monitoring Water Quality: OverviewEffect of Temperature on CalibrationThe most successful calibrations reproduce field conditions as nearlyas possible, especially temperature. It is best to calibrate at theexpected field temperature.RinsingAs a general guideline, we recommend you rinse the Cal Cup, thefront end of the MP <strong>TROLL</strong> <strong>9500</strong>, and the installed sensors prior tobeginning calibration. This will remove trace contaminants or solutionsused in previous calibrations, and prepare the instrument for a cleancalibration.A good way to do this is to fill the Cal Cup with water, attach to theinstrument, and shake vigorously. This may need to be done a coupleof times.Rinse first in tap water, followed by a rinse with distilled or deionizedwater.Shake or wipe with a clean lint-free tissue to dry. It is not necessary todry thoroughly.Some calibration procedures also recommend a rinse in the selectedcalibration solution. In this case, drying is not necessary.StirringWhen to Stir?The stirrer accessory should be used during a calibration procedureif it will also be used during field use—for example, if the instrumentwill be in stagnant or very slowly moving water. The more closelycalibration conditions reflect field conditions, the more successful thecalibration. This is especially important when calibrating the ISE sensors(ammonium, chloride, and nitrate).ISE sensors in close proximity to each other can sometimes createinterferences. Constant stirring can enhance the performance of theISE sensors.Attaching the Stirrer for CalibrationTo use the battery-powered stirrer for calibration, attach it to the MP<strong>TROLL</strong> <strong>9500</strong> and Cal Cup as follows. See illustration C on the followingpage.1. Remove the restrictor (nose cone attached) from the MP <strong>TROLL</strong><strong>9500</strong> and set it aside.2. Remove the black end cap from the Cal Cup.3. Screw the top of the stirrer (propeller end) to the bottom of the CalCup (the end from which you just removed the end cap).4. Fill Cal Cup to fill line with solution.5. Attach Cal Cup/stirrer assembly to front end of MP <strong>TROLL</strong> <strong>9500</strong>.Starting the StirrerThe stirrer is powered by two alkaline D-cells (installed). To start the motor, tightenthe end cap.The magnetic stir bar in the propellercompartment will start to spin. The stir baris protected by a guard plate that may beremoved for cleaning if necessary.Stirrer← →off onPropellercompartmentMotor compartmentBattery compartmentEnd capTIP: Should the stir bar not start spinning, try giving it agentle nudge by sliding a narrow tool such as a screwdriveror key between the protective bars of the guard plate.To turn the stirrer off, back off the end cap until the stir bar stops spinning.Calibration ProceduresRefer to the following sections for specific calibration procedures andguidelines:Quick Cal Section 3pH Section 11Conductivity Section 12Dissolved Oxygen (polarographic) Section 13, first halfDissolved Oxygen (optical)Section 13, second halfORP Section 14Ammonium Section 15Chloride Section 16Nitrate Section 17Turbidity Section 18After CalibrationWhen you finish calibrating with any method, the following happens:• The newly calculated calibration coefficients are written to the“smart sensor” memory.• You have the option of viewing the calibration report. The reportmay be viewed immediately after calibration, or at any time. SeeCalibration History, below.• The sensors are ready to take measurements.<strong>TROLL</strong> <strong>9500</strong> Operator’s <strong>Manual</strong> 620095110 rev. 007 01/09
Section 10: Monitoring Water Quality: OverviewSensor StorageIt is best to calibrate just before field use. However, should you needto store calibrated sensors, there are a couple of options:• If the instrument will be used in a day or so, leave the sensors installed.Remove the Cal Cup and rinse it and the sensors. Moistena sponge and place it in the bottom, or add a little water (deionized,distilled, or tap) to the Cal Cup—just enough to create a moistenvironment. Return the probe to the Cal Cup for transport to thefield site.TIP: Deionized water is preferred over tap water, but it is notessential; especially if the local tap water is of good quality.To seal the Cal Cup against leakage, seat it lightly againstthe o-ring on the instrument body. It is best not to overtighten.• For longer storage, remove the sensors from the MP <strong>TROLL</strong> <strong>9500</strong>.Store the conductivity sensor dry. Store the DO, pH, and pH/ORPsensors in their storage bottles (located in the sensor kits): DO inclean water, pH and pH/ORP in the solution they were shipped in,or with a moist sponge in the sensor storage bottle to avoid depletingthe reference solution.Calibration HistoryAMP <strong>TROLL</strong> <strong>9500</strong>A. with restrictor and nose coneBB. with Cal Cup in place of restrictor and nose coneC. with Cal Cup and stirrer, for stirring calibrationsD. with Restrictor and stirrer, for monitoring water quality instagnant waterCDEach time a sensor is calibrated, the information is written to thesensor, where it is stored until the next calibration. Details on the mostrecent calibration are displayed by the software when a parameter isselected in the Navigation tree.The software also creates a calibration report in html format each timea sensor is calibrated. A separate report is created for every calibrationof every parameter—even for a calibration that was cancelled.You have the option to view the report immediately after calibration.Reports are stored for later retrieval and reference in a folder named“Calibration Reports” in the folder where Win-Situ 4 or Pocket-Situ4 is installed. Reports include a detailed record of date and time,parameter, calibration type, number of calibration points, stimulus andresponse, and calculated coefficients. An index in html format is alsocreated and updated each time a calibration is performed.<strong>TROLL</strong> <strong>9500</strong> Operator’s <strong>Manual</strong> 630095110 rev. 007 01/09
Section 10: Monitoring Water Quality: OverviewWhen you select the sensor . . .. . . informationon the lastcalibration isshownHow Often to CalibrateNo sensor will remain in calibration forever. The calibration frequencyis almost completely determined by the chemical properties of thefluid being monitored, and the accuracy you wish to achieve fromthe instrument. For example, when used in relatively clean water, ina normal pH range, at a relatively stable temperature, some sensorscould remain in calibration for a couple of weeks or longer. On theother hand, in surface water with a high nutrient content and widetemperature fluctuations, the sensors may need to be cleaned andrecalibrated every few days. Your own measurement results are thebest guide to the need to recalibrate.pH calibration information for a combination pH/ORP sensor in port 1The calibration reports are accessible from the Tools Menu and theShow Calibration Report button on the toolbar. They may alsobe accessed like other files through Windows Explorer (desktop PC)or File Explorer (PDA); they are not displayed in the Data Folder. Theymay be viewed or printed to provide a complete calibration history.TIP: Here’s how to find the calibration report indexes:Desktop or laptop PC—Calibration Reports subfolder in the folderwhere Win-Situ 4 is installedPDA—Calibration Reports subfolder in the folder where Pocket-Situ4 is installedExample of a calibration report indexFolders:FolderSN32072SN45025Click a folder to see its listingsClick a tile to open itSN32072Files:File NameSN32072 2006-04-17 171530 TURB.htmlSN32072 2006-06-18 102309 DO.htmlSN32072 2006-08-14 134200 QuickCal.htmlSN32072 2006-11-25 121530 PH.htmlSN32072 2007-01-11 154322 Cond.htmlWhen a sensor or instrument is new, we recommend checking thereadings often (say, once a day) to get an idea of the stability of thesensor.Changes in flow also affect readings. Constant flow will increase theaccuracy. This can be achieved with the stirring accessory.The table below may be used as a very general guideline to how longsensors may be expected to remain in calibration under optimumconditions:pH, ORP1-2 monthsConductivity 2-3 monthsD.O. (polarographic) 2-4 weeksD.O. (optical, RDO) up to a year if foil is not damagedISEs1 dayTIP: For additional information on calibration schedules, seethe Technical Note on Instrument Calibration in theDownloads section at www.in-situ.com.How to Check if a Sensor is Still in CalibrationImmerse the sensor in a calibration standard of known value and atthe same temperature as the original calibration. Compare the sensorreading to the solution value. Some drift is to be expected, but generallythe readings should fall within the sensor’s accuracy specification.If readings fall outside the accuracy specification by an amount thatis not acceptable for your current application, recalibration is recommended.You will quickly learn by experience how often you need torecalibrate a given sensor based on usage.TIP: Quick Cal solution may be used for a quick check ofpH, ORP, and conductivity. Refer to the values printed on thelabel.MP <strong>TROLL</strong> <strong>9500</strong>serial numberCal DateCal Time(hhmmss)Parameter<strong>TROLL</strong> <strong>9500</strong> Operator’s <strong>Manual</strong> 640095110 rev. 007 01/09
Section 10: Monitoring Water Quality: OverviewWhen to Replace a SensorAfter a certain amount of use even a complete recalibration will notbe able to accurately calculate calibration coefficients. The slope willgradually become lower and lower. At this point the sensor should bereplaced. Specific slope guidelines for individual sensors are given inthe individual parameter sections below.Using a StirrerIn-Situ’s stirrer accessory provides continuous sample circulation oragitation, which can improve the performance of water-quality sensorsin a number of applications.Dissolved oxygen (DO) measurements drop in very stagnant waterdue to depletion of oxygen next to the membrane. A slight perturbationto the system will cause the DO measurements to return to normal.Stirring is recommended if the instrument is anchored to a fixed structurein stagnant conditions—for example, attached to a pier in a calmlake that has no underwater currents. If the wind is blowing and wavesare slightly moving the cable, then stirring is probably not necessary.ISE sensors in close proximity to each other can sometimes createinterferences. Constant stirring can enhance the performance of theISE sensors.Sample agitation can also help to improve sensor response timewhen water-quality conditions are subject to change (e.g., in a movingcontaminant plume) and can speed up temperature stabilization.Attaching the Stirrer for Field UseThe stirrer accessory is easily installed on the MP <strong>TROLL</strong> 9000. Seeillustration D earlier in this section.1. Remove the nose cone from the MP <strong>TROLL</strong> <strong>9500</strong>. Leave therestrictor attached to the instrument.2. Screw the top of the stirrer (propeller end) to the stainless steelrestrictor in place of the nose cone.3. Start the stirrer; see Starting the Stirrer earlier in this section.The instrument is ready for use in stagnant water.Q:A:ReferencesHow can I find the serial number of a water quality sensor—pHfor example?The software can display the sensor serial number. Do this:1 Select pH in the Navigation tree2 Look at the information displayed The serial number isdisplayed in the Information pane on the right side of thescreen (or at the bottom on a PDA)Eaton, A.D., L.S. Clesceri, E.W. Rice, and A.E. Greenberg, eds.,Standard Methods for the Examination of Water and Wastewater,21st edition, Washington, D.C.: American Public Health Association,American Water Works Association, and Water EnvironmentFederation, 2005.A Fish Farmer’s Guide to Understanding Water Quality. LaDonSwann, Dept. of Animal Sciences, Illinois-Indiana Sea GrantProgram, Purdue University. On the web at AquaNIC (AquacultureNetwork Information Center), aquanic.org.Rundle, Chris C., A Beginners Guide to Ion-Selective ElectrodeMeasurements. Nico2000 Ltd., London, UK. On the web at www.nico2000.netWater on the Web (WOW). University of Minnesota project initiallyfunded by the National Science Foundation. On the web at wow.nrri.umn.eduWater Quality Sensor Pressure RatingsPressure Rating Usable DepthSensor PSI Meters FeetpH 300 210 692pH/ORP 300 210 692Conductivity 350 246 807D.O. polarographic* 350 246 807Turbidity 350 246 807Wiper 350 246 807Chloride 100 70 231Ammonium 20 14 46Nitrate 20 14 46RDO exceeds rating of the <strong>TROLL</strong> <strong>9500</strong>* Submersion and retrieval at up to 4 feet per second.<strong>TROLL</strong> <strong>9500</strong> Operator’s <strong>Manual</strong> 650095110 rev. 007 01/09
Multi-ParameterWater Quality <strong>TROLL</strong> ®11 pHWhat Is pH?The term pH is derived from “p” meaning power and “H” for the elementhydrogen and literally means “power of hydrogen.” pH is definedas the negative logarithm of the hydrogen ion activity (or concentrationin moles/liter):pH = - log [ H + ] or [H + ] = 10 -pHWater (H 2O) dissociates into hydrogen ions (H + ) and hydroxide ions(OH – ) in aqueous solution. At 25°C there are 1.0 x 10 –7 moles/L ofhydrogen ions and 1.0 x 10 –7 moles/L of hydroxide ions in pure water.Thus the water is neutral (pH = 7) because there are equal amountsof each ion. Addition of a substance with hydrogen or hydroxide ionswill shift the balance and cause the water to become either acidic orbasic.The pH scale ranges from 0 (most acidic) to 14 (most basic or leastacidic). A change of 1 pH unit corresponds to a tenfold change inhydrogen ion concentration.Why Measure pH?A pH value indicates the amount of hydrogen ion that is present in anaqueous environment. The hydrogen ion concentration gives an indicationof the acidity of a substance. pH is an important measurementin natural waters because most chemical and biochemical processesare pH dependent. The physiological chemistry of most living organismscan tolerate only small changes in pH and still provide the chemicalreactions that sustain life. The solubility of many chemicals is pHdependent. Thus, pH determines their availability to living organisms.Typical pH valuesFluidpH unitsAcid rain < 5Distilled water 5.6Most natural waters 8Safe for freshwater fish 6-9Properly chlorinatedswimming pool 7.2 - 7.6Natural waters usually have pH values in the range of 4 to 9. Mostnatural waters are slightly basic (~ pH 8) because of the presence ofcarbonates (CO 32–) and bicarbonates (HCO 3–). Extremely fresh watercan even be slightly acidic (~ pH 6), depending on the concentrationof dissolved carbon dioxide (CO 2). The carbon dioxide combines withwater to form a small amount of carbonic acid (H 2CO 3) and this processlowers the pH. Nitrogen oxides (NO x) and sulfur dioxides (SO 2)from automobile exhaust and the burning of coal combine with waterin the atmosphere to form nitric (HNO 3) and sulfuric acid (H 2SO 4).This falls to the ground as acid rain and accumulates in surface water.Runoff from mining spoils and the decomposition of plant materialscan also cause acidic surface water.pH values below 5 in natural waters are generally considered to betoo acidic. Freshwater fish seem to do well in the pH range of 6 to 9.Acidic drinking water is a concern because of its corrosive characteristicsto plumbing and appliances. pH also affects the ammonia/ammonium(NH 3/NH 4+) equilibrium in water. Even a small amount ofammonia is detrimental to fish while a moderate amount of ammoniumis tolerated. At a pH of 6.5 almost all ammonia is in the form ofammonium. However, as the pH becomes slightly basic, ammonium ischanged into harmful ammonia. The lethal dose of ammonia for troutis only 0.2 mg/L.The pH SensorpH electrodes use a potentiometric method to measure the pH ofa solution. The pH sensor consists of a pH-sensitive glass whosevoltage is proportional to the hydrogen ion concentration. A secondsensor (electrode) serves as a reference, which supplies a constantstable output. Electrical contact is made with the solution using asaturated potassium chloride (KCl) solution. The electrode behavior isdescribed by the Nernst equation:E m= E o+ (2.3 RT/nF) log [H + ]whereE mis the potential from the pH electrode,<strong>TROLL</strong> <strong>9500</strong> Operator’s <strong>Manual</strong>660095110 rev. 007 01/09
Section 11: pHE ois related to the potential of the reference electrode,R is the Gas Law constant,F is Faraday’s constant,T is the temperature in Kelvin,n is the ionic charge (+1 for Hydrogen), and[H + ] is the hydrogen ion concentration in moles/L.The MP <strong>TROLL</strong> <strong>9500</strong> reads the signal from the pH electrode, thereference electrode, and the temperature and then calculates the pHusing the Nernst equation.Sensor InstallationThe MP <strong>TROLL</strong> <strong>9500</strong> may be shipped with a pH or combination pH/ORP sensor installed. If installation is necessary, unpack and installthe sensor in the MP <strong>TROLL</strong> <strong>9500</strong> as follows.A combination pH/ORP sensor will work properly only inport 1. A pH sensor may be installed in port 1 or 3.TIP: To ensure optimum response for a new or previouslystored sensor, rinse off the soaking solution, then soak thesensor in clean water for at least 15 minutes before calibrating.1. Remove the restrictor or Cal Cup from the front end of the MP<strong>TROLL</strong> <strong>9500</strong>. This allows access to the sensor block shown below.2. Remove the sensor hydration bottle and set aside for future use.3. Rinse the sensor in clean water to remove the soaking solution.Soak the sensor in clean water for at least 15 minutes beforecalibrating.4. Remove any moisture or dirt from the area aroundthe port where you will install the sensor, then use thesensor removal tool to remove the plug from the port.Retain the plug for future use.5. Remove any moisture or dirt from the port connectorwith a clean swab or tissue.sensorremovaltool6. Remove the cap from the sensor connector. Check lubrication ofthe o-rings. If they appear dry, apply a silicone lubricant beforeinstallation.7. Visually align the sensor connector pins with the port connector pins.8. Press the sensor into the port until you feel it dock with the port connector.When properly inserted a small gap (the width of the sensorremoval tool) remains between the instrument body and the widestpart of the sensor, for ease of removal.CalibrationOverviewSeveral options are available for pH calibration.• Quick Cal: Calibrates all basic sensors (pH, ORP, polarographicD.O., conductivity) at the same time with one convenient solution. Aone-point calibration in pH 7; default slope, calculated offset.• Traditional calibration–1 point: requires a single solution; resultsin calculation of sensor offset for a single pH value (pH 4, 7, or10). Select a calibration solution for the region of the pH range youexpect to measure. A one-point calibration may be used with goodresults when the sensor is new.• Traditional calibration–2 point: requires two solutions; results incalculation of sensor slope and offset for one pH range (pH 4-7 orpH 7-10). Choose solutions that bracket the expected pH range:pH Sensor PositionspH/ORP Sensor PositionPressure/Turbidity(or plug)Pressure/Turbidity(or plug)TemperatureTemperatureInstall a pH sensor inport 1 or port 3alignment markInstall a pH/ORPsensor in port 1alignment mark<strong>TROLL</strong> <strong>9500</strong> Operator’s <strong>Manual</strong> 670095110 rev. 007 01/09
Section 11: pH• 4.0 and 7.0 pH buffer solutions for neutral to acidic conditions• 7.0 and 10.0 pH buffer solutions for neutral to basic conditions• Traditional calibration–3 point: requires three solutions; results incalculation of slope and offset for 2 ranges (pH 4-7 and pH 7-10).The correct slope for the pH values being monitored will automaticallybe applied. A 3-point calibration is useful when the pH rangeof the environmental fluid is completely unknown.• Resets the sensor’s factory defaults. No solutions are required.Nominal vs. StableTo shorten the calibration time, you have the option to accept thecalibration when “Nominal” stability conditions are achieved. If theearly value is accepted, the calibration point will be designated “USERSET” in the calibration report. If the calibration report indicates thatcalibration was performed through to stability then the instrument willoperate as intended by In-Situ’s quality standards.Calibration SolutionsCalibration solutions certified to N.I.S.T. standards are supplied in theIn-Situ pH Calibration Kit: pH 4, pH 7, pH 10 buffer, and deionizedwater. Catalog No. 0032080. Solutions are also available separately.TIP: Most solutions are usable beyond their stated expirationdate, depending on storage conditions; however, the resultscannot be guaranteed.Primary standard buffer salts are available from the National Bureauof Standards, and may be used in situations where extreme accuracyis required. Commercially available pH buffers may be used.Recommended Calibration FrequencyCalibration frequency will depend on the nature of the sample and thedegree of accuracy required. In clean water samples, the pH sensorshould retain its accuracy for 2-6 weeks before requiring recalibration.Recalibrate the sensor—• after replacing the reference junction and/or the filling solution,• during routine, scheduled maintenance,Recommended Calibration Order for pH and ORP• every 2-6 weeks in the absence of other indications.pH Quick CalThe procedure to Quick Cal the pH sensor (a 1-point calibration at pH7), along with other sensors in the Basic Sensor Set, may be found inSection 3, Getting Started.To perform a more accurate traditional calibration, follow the procedurebelow.TIP: The pH calibration procedure is the same for pHsensors and pH/ORP sensors.Traditional pH Calibration Procedure1. With a pH or pH/ORP sensor installed and plugs or sensors in theother ports, rinse the front end of the MP <strong>TROLL</strong> <strong>9500</strong> in tap water,then again in deionized water. Shake to dry.For the most accurate results, follow this with a rinse in a portion ofthe selected calibration solution.2. Insure the black PVC base is attached to the Cal Cup, and fill theCal Cup to the fill line with the selected calibrationsolution.• Begin with the lowest buffer value when performinga multi-point calibration.• With a full complement of sensors installed, usethe lower line as a guide.• With 1 or 2 removable sensors installed, fill to theupper line.3. Insert the front end of the MP <strong>TROLL</strong> <strong>9500</strong> into theopen end of the Cal Cup. Thread the Cal Cup ontothe body until seated against the o-ring, then backoff slightly to avoid overtightening.4. Connect the MP <strong>TROLL</strong> <strong>9500</strong> to a PC and establisha connection in Win-Situ 4 or Pocket-Situ 4. Win-Situ screens areillustrated here. The Pocket-Situ interface is similar, with the Navigationtree at the top of the screen and the Information pane belowit.3The pH/ORP sensor requires separate calibrations for pH and ORP.A suggested calibration scenario is as follows:A. First, Quick-Cal ORP (plus, optionally, other installed Basic sensors).For the procedure, see Section 3, Getting Started.B. Then, perform a 2- or 3-point Traditional pH calibration asdescribed here.<strong>TROLL</strong> <strong>9500</strong> Operator’s <strong>Manual</strong> 680095110 rev. 007 01/09
Section 11: pH5. Select the MP <strong>TROLL</strong> <strong>9500</strong> in the Navigation tree.10. In the next screen, select Run to begin the stabilization.The software will automatically detect and display the installed sensors.If one or more sensors is installed in the wrong port, an errormessage will be displayed. Simply remove the sensor and install itin the correct position, then “refresh” the device before continuing.6. Click to select pH in the Parameters list. The sensor serial number(SN) and recent calibration information is displayed.1067. Select Calibrate to launch the pH Calibration Wizard. A screen likethis is displayed.7The display will continuously update as readings are taken andcompared against the stabilization criteria.11. If doing a one-point calibration, go to step 14.For a multi-point calibration, the Wizard returns to the screenshown at step 10 and waits for you to situate the probe in the nextcalibration solution and click Run.Indicators during Calibration• Status:8. Select the number of calibration points for this calibration, and thepH value of the calibration solution for each point. Cal point 1 isthe solution the sensor is soaking in now.9. Select Next to continue.98NOT TESTED is displayed until you begin the calibration by selectingRun.UNSTABLE indicates the sensor response does not meet the criteriafor a valid calibration point.NOMINAL indicates the sensor deviation meets early stabilizationcriteria.The Accept button becomes available when nominal stability isachieved. You may accept the early value, or wait for complete stability.If you accept the early value, the calibration point will be designated“USER SET” in the calibration report. (For more on calibration reports,see “Calibration History” in Section 10.)STABLE is displayed when the readings have stabilized sufficiently totake a valid calibration point. The calibration proceeds automatically tothe next screen.• Sensor Reading: The current sensor response in milliVolts.• Sensor Deviation: Change in sensor response between the last tworeadings. This enables you to follow the progress of the stabilization,but deviation from the previous reading is not necessarily the bestindicator of stability as the software is looking at longer-term trends.<strong>TROLL</strong> <strong>9500</strong> Operator’s <strong>Manual</strong> 690095110 rev. 007 01/09
Section 11: pH12. Remove the Cal Cup, discard the first solution, rinse the Cal Cupand the front end of the instrument, refill the Cal Cup with thesecond solution, and attach it to the instrument.TIP: The calibration solution may be flushed down the drainwith running water, or saved in a separate container andused to rinse the next time you calibrate with the same solution.13. Select Run to begin the stabilization for the second calibrationpoint. Status indicators and controls are the same as for the firstcalibration point (step 10).For a 3-point calibration, repeat steps 12 and 13.14. The final screen shows the sensor slope and offset calculatedduring calibration. For a 3-point calibration, 2 sets of coefficientswill be shown.Resetting Default CoefficientsThe sensor’s calibration may be reset back to factory defaults at anytime. As the sensor ages, the coefficients calculated during calibrationwill deviate more and more from the nominal values, which arederived from new sensors. Default coefficients will give reasonableresults when the sensor is relatively new.1. With a pH or combination pH/ORP sensor installed, establish aconnection to the instrument in Win-Situ 4 or Pocket-Situ 4.2. Select pH in the Parameters list and click Calibrate.3. In the first screen, select Use Nominal Coefficients, then Next.4. In the final screen, click Finish to send the values to the sensor.Sensor Slope and OffsetThe pH calibration curve pivots around pH 7 (0 mV response). Theoffset calculated by the software when calibrating at pH 7 will typicallybe between 372-450 mV. If the offset falls much outside these limits,replace the filling solution or the junction (see the following page).The slope should fall between -54 mV/pH and -62 mV/pH. A calculatedslope greater than -50 mV/pH or less than -66 mV/pH indicatesthat the sensor requires maintenance (see the following page).15mV“Pivot pH” is the point at which the slope characteristics changewith a 3-point (2-range) calibration. The correct slope for the pHvalues being monitored will automatically be applied.15. Select Finish to program the sensor with the newly calculatedcalibration coefficients.TIP: You can look at the calibration report right aftercalibrating, or at any time. See “Calibration History” inSection 10 for details.Options for storing the sensor:• If the instrument will be used in a day or so, leave the sensorsinstalled. Remove the Cal Cup and rinse it and the sensors. Add50-100 mL of tap water to the Cal Cup. Return the probe to the CalCup for transport to the field site.• For longer storage, see Sensor Care and Handling, below.pHUnits and Calculated MeasurementsReadings from pH channel are displayed in pH units. No calculatedmeasurements are available.Usage Recommendations and Cautions• Temperature compensation is provided in the software to accountfor measurements taken at temperatures different from the calibrationtemperature. For most accurate results, try to calibrate at thesame temperature as the expected sample temperature.• A small error in pH will occur in basic solutions (>pH 10) thatcontain high levels of sodium salts (>0.01M) due to sodium interference.Contact In-Situ for more information.<strong>TROLL</strong> <strong>9500</strong> Operator’s <strong>Manual</strong> 700095110 rev. 007 01/09
Section 11: pH• pH readings in pure water samples (
Multi-ParameterWater Quality <strong>TROLL</strong> ®12 ConductivityWhat Is Conductivity?Electrical conductivity measures the ability of a material to carry anelectric current. Lakes, rivers, oceans, and underground aquifersare typically good conductors because they contain dissolved saltsand minerals. These salts and minerals dissociate in the presenceof water to form negatively and positively charged particles calledanions and cations. Anions and cations provide a pathway for thetransportation of electrical charges throughout the aqueous medium.For the most part, the higher the concentration of dissolved salts andminerals in water, the better the conductor and the higher the electricalconductivity. Deionized/distilled water is a poor conductor becausealmost all anions and cations are removed during the deionization/distillationprocess.Why Measure Conductivity?Changes in the conductivity of a body of water are often used to indicatean environmental event. For example, a drastic increase in theelectrical conductivity of an underground fresh water aquifer locatednear the ocean could indicate the beginning of salt water intrusion.On the other hand, an increase in the electrical conductivity of a smalllake that is completely surrounded by farmland may simply be theresult of runoff from a recent rain.How is Conductivity Measured?Conductance is the reciprocal of the resistance, in ohms, measuredbetween two opposing electrodes of a 1 cm cube at a specific temperature.The unit 1/ohm or mho was given the name of Siemens (S) forUltra-pure distilled waterDistilled waterDrinking waterSurface waterSea waterGreat Salt LakeTypical Conductivity values0.05 µS/cm1.0 µS/cm50 to 300 µS/cm100 to 10,000 µS/cm40,000 to 55,000 µS/cm158,000 µS/cmconductance. It is not practical to require all conductance cells to havethe dimensions of an exact cube. To enable the comparison of datafrom experiments with different conductance cells, the conductance ismultiplied by the cell constant to give conductivity in Siemens per centimeter(S/cm). Cell constants are determined for each sensor using astandard solution of known conductivity. The cell constant depends onthe electrode area and the amount of separation or distance betweenthe electrodes.Early conductivity measurements were performed using cells with twoelectrodes. This method required using three conductivity cells withdifferent cell constants in order to span the range of 1 to 100,000 microSiemensper centimeter (µS/cm). Another inconvenience occurredwhen deposits formed on the electrodes, thus reducing the measuredconductivity of the sample.The modern four-electrode conductivity cell offers many advantagesover the two-electrode method. It contains two drive electrodes andtwo sensing electrodes. The sensing electrodes are positioned in alow current area so that electrode fouling is minimized. An alternatingcurrent is used to drive the cell. This reduces errors caused bypolarization resulting from the application of a direct current.The Conductivity SensorsTwo conductivity sensors are available, optimizedfor performance in different areas of the conductivityrange. Chemically resistant electrodes are used forlower reactivity in high conducting samples (carbonelectrodes in the low-range sensor, passivated stainlesssteel electrodes in the high-range sensor).The conductivity sensors are shorter than theother water quality sensors in order to distance theconductivity cell from the KCl reference solutions inother sensors. Low High<strong>TROLL</strong> <strong>9500</strong> Operator’s <strong>Manual</strong>720095110 rev. 007 01/09
Section 12: ConductivityTypeOperating Range Cell Constant RangeLow 3 to 50,000 µS/cm 0.33 – 0.39 cm -1High 70 to 200,000 µS/cm 4.4 – 5.8 cm -1Sensor InstallationThe MP <strong>TROLL</strong> <strong>9500</strong> may be shipped with a conductivity sensoralready installed in port 4, as shown on the drawing below. If installationis necessary, unpack and install the conductivity sensor in port 4as follows.The conductivity sensor will function properly only wheninstalled in port 4.1. Remove the restrictor from the front end of the MP <strong>TROLL</strong> <strong>9500</strong>.This allows access to the sensor block shown in the drawing below.2. If there is a cap on the connector end of the sensor, remove it andset it aside for future use.3. Remove any moisture or dirt from the area aroundport 4, then use the sensor removal tool to removethe plug from the port. Retain the plug for future use.4. Remove any moisture or dirt from the port connectorwith a clean swab or tissue.5. Check lubrication of the sensor o-rings.TIP: The sensor o-rings require generous lubrication beforeinstallation. New sensors will be lubricated at the factory. Ifthe o-rings appear dry, apply a silicone lubricant before installation.sensorremovaltool6. Align the mark on the side of the sensor with the mark on the port.7. Firmly press the sensor into the port until you feel it dock with theconnector at the bottom of the port. When properly inserted a smallgap (width of the sensor removal tool) remains between the widestpart of the sensor and the instrument body, for ease of removal.CalibrationOverviewThe conductivity calibration calculates the cell constant for the conductivitysensor. A one-point calibration is sufficient. Best results willbe obtained if you calibrate with the solution for the range you expectto measure, and at the temperature you expect during field use.Nominal vs. StableTo shorten the calibration time, you have the option to accept thecalibration when “Nominal” stability conditions are achieved. If theearly value is accepted, the calibration point will be designated “USERSET” in the calibration report. If the calibration report indicates thatcalibration was performed through to stability then the instrument willoperate as intended by In-Situ’s quality standards.Calibration Solutions (Primary Standards)Potassium chloride (KCl) calibration solutions certified to N.I.S.T.standards are supplied in the In-Situ Conductivity Calibration Kits.The value on the bottle indicates the solution’s specific conductance(conductivity at 25°C). Select an appropriate solution for your applicationfrom the following:Fresh water147 µS/cm solutionFresh to brackish water 1,413 µS/cm solutionBrackish water 12,890 µS/cm solutionSea water58,670 µS/cm solutionThe standard conductivity calibration kit includes a quart each of 147µS/cm, 1,413 µS/cm, 12,890 µS/cm and deionized water. Catalog No.0032090. Solutions are available separately, and specialized kits areavailable for fresh and salt water applications.TIP: Most solutions are usable beyond their stated expirationdate, depending on storage conditions; however, the resultscannot be guaranteed. The 147 µS/cm solution should berefrigerated.Pressure/Turbidity(or plug)Conductivity sensorgoes herealignment markTemperatureCalibrating with Other SolutionsA custom solution may be used if its specific conductance value (inµS/cm) at 25°C is known. Calibration to secondary standards mayalso be performed. This involves a manual calculation of the cellconstant. See the procedure later in this section.Recommended Calibration FrequencyYour own experience is the best guide to how often the conductivitysensor will benefit from recalibration. Refer to the general guidelinesunder “How Often to Calibrate” in Section 10, and to the tech note on“Instrument Calibration.”<strong>TROLL</strong> <strong>9500</strong> Operator’s <strong>Manual</strong> 730095110 rev. 007 01/09
Section 12: ConductivityConductivity Quick CalThe procedure to Quick Cal the conductivity sensor (a 1-point calibrationat approximately 8,000 µS/cm), along with other sensors in theBasic Sensor Set, may be found in Section 3, Getting Started. Toperform a more accurate calibration for a specific conductivity range,follow the procedure below.Traditional Conductivity Calibration Procedure1. With a conductivity sensor installed and plugs or sensors in theother sensor ports, rinse the front end of the MP <strong>TROLL</strong> <strong>9500</strong>.here. The Pocket-Situ interface is similar, with the Navigation treeat the top of the screen and the Information pane below it.5. Select the MP <strong>TROLL</strong> <strong>9500</strong> in the Navigation tree.The software will detect and display the installed sensors. If anysensor is installed in the wrong port, an error message will bedisplayed. Simply remove the sensor and install it in the correctposition, then “refresh” the device before continuing.6. Select conductivity in the Parameters list. The sensor serial number(SN), type, and recent calibration information is shown.To calibrate using a medium- to high-range solution, rinse in tapwater and shake to dry.To calibrate using a low-range solution, it is important to rinse well;we recommend a rinse with tap water, then with deionized water,followed by a rinse with the solution to be used for calibration.TIP: For highest accuracy, conductivity sensors should bewetted for 15-30 minutes immediately prior to calibration.This immersion can be in either clean water or the conductivitycalibration solution.672. Insure the black PVC base is attached to the Cal Cup, and fill theCal Cup with the selected calibration solution.• Low-range sensor: Fill to the lower or upper line depending onthe number of sensors installed (fewer sensors require moresolution).• High-range sensor: Fill to or above the upper line,depending on the sensor load. You need enoughsolution to immerse the sensor’s side ports.3. Insert the front end of the MP <strong>TROLL</strong> <strong>9500</strong> into theopen end of the Cal Cup. Thread the Cal Cup ontothe body until seated against the o-ring, then backoff slightly to avoid overtightening.• Low-range sensor: the open area of the sensorshould be completely immersed.• High-range sensor: the side openings should becompletely immersed.3• The temperature sensor should be immersed inabout an inch of liquid.• If any air bubbles are visible on the sensor, tapthe sides or bottom of the Cal Cup to dislodgethem. Or invert the Cal Cup a couple of times.4. Connect the MP <strong>TROLL</strong> <strong>9500</strong> to a PC and establish a connectionin Win-Situ 4 or Pocket-Situ 4. Win-Situ screens are illustrated7. Select Calibrate.The Conductivity Calibration Wizard starts. Available calibrationranges will depend on the sensor installed (high or low range)8. Select the calibration solution the sensor is soaking in.For a custom solution, select Other and enter the Specific Conductanceof the solution (conductivity corrected to 25°C) in µS/cm.9. Select Next to continue.98<strong>TROLL</strong> <strong>9500</strong> Operator’s <strong>Manual</strong> 740095110 rev. 007 01/09
Section 12: Conductivity10. In the next screen, select Run to begin the stabilization.11. The final screen shows the new cell constant (Kcell) calculated forthe selected range during the calibration process.1012The display will continuously update as readings are taken andcompared against the stabilization criteria.• Status indicators:NOT TESTED is displayed until you begin the calibration byselecting Run.UNSTABLE indicates the sensor response does not meet thecriteria for a valid calibration point.NOMINAL indicates the sensor deviation meets early stabilizationcriteria.The Accept button becomes available when nominal stability isachieved. You may accept the early value, or wait for completestability. If you accept the early value, the calibration point willbe designated “USER SET” in the calibration report. (For moreon calibration reports, see “Calibration History” in Section 10.)STABLE is displayed when the readings have stabilized sufficientlyto take a valid calibration point. The calibration proceedsautomatically to the next screen.• Temperature at the time of calibration is displayed for your information.• Sensor Reading: The current sensor response in ohms.• Sensor Deviation: Change in sensor response between the last tworeadings. This enables you to follow the progress of the stabilization,but deviation from the previous reading is not necessarily thebest indicator of stability as the software is looking at longer-termtrends.Typical cell constants:Low-range sensor 0.32 – 0.39High-range sensor 4.4 – 5.8The displayed cell constant may be edited.12. Select Finish to program the sensor with the displayed cell constant.TIP: You can look at the calibration report right aftercalibrating, or at any time. See “Calibration History” inSection 10 for details.The conductivity sensor is now calibrated and ready to use in therange for which it was calibrated.TIP: The calibration solution may be flushed down the drainwith running water, or saved in a separate container andused to rinse the sensors the next time you calibrate with thesame solution.Options for storing sensors:• If the instrument will be used in a day or so, leave all the sensorsinstalled in the MP <strong>TROLL</strong> <strong>9500</strong>. The conductivity sensor does notrequire any special storage conditions, but other sensors do. Referto the relevant sections of this manual for storage recommendationsfor other installed sensors.• Remove the conductivity sensor from the MP <strong>TROLL</strong> <strong>9500</strong>, rinse it,and store it dry.<strong>TROLL</strong> <strong>9500</strong> Operator’s <strong>Manual</strong> 750095110 rev. 007 01/09
Section 12: ConductivityUsing a Conductivity Meter as a Secondary StandardIf a conductivity meter is available for comparison, the cell constant(Kcell) for the conductivity sensor can be calculated by hand andentered manually into the software.1. Note the current cell constant. Immerse the MP <strong>TROLL</strong> with conductivitysensor in a solution. Take and record the reading.2. Take and record a reading in the same solution with a conductivitymeter.3. Solve the following for X:4. This is the new cell constant. Enter this value in the software asdescribed below.Entering a Cell Constant <strong>Manual</strong>lyA cell constant may be entered “manually” without running a completecalibration.1. With a conductivity sensor installed, establish a connection to theinstrument in Win-Situ 4 or Pocket-Situ 4.2. Select Conductivity in the Parameters list and click Calibrate.3. Select Other, and key in any reasonable value. Press Next twice toget to the final screen.4. In the final screen, key in the desired cell constant.5. Click Finish to send the new value to the sensor.Units and Calculated MeasurementsBasic Unit: ACCurrent KcellReading with this Kcell=Absolute (or “actual”) conductivity, without temperature compensation,is the basic unit for the conductivity sensor. Measurements may bedisplayed in:microSiemens per centimeter (µS/cm AC)milliSiemens per centimeter (mS/cm AC)The following units are also available for displaying derived measurementscalculated from the conductivity channel output:TIP: To change unit preferences: In Win-Situ, selectPreferences on the Options menu. In Pocket-Situ, select theHome site, then tap Setup in the command bar.XConductivity meter readingTIP: Since the specific ionic composition of all analytescannot be known, the conversions provided in the softwareare reasonably good estimates of Specific Conductance andTotal Dissolved Solids. The resulting derived values should betreated with caution.Specific Conductance (SC)Specific Conductance is conductivity corrected to 25°C. The softwareestimates what the conductivity would be at 25°C to enable comparisonbetween measurements made at different temperatures.The conversion requires a temperature coefficient for the solutionbeing measured. By convention, the temperature coefficient for potassiumchloride (KCl) calibration standards is used. Specific conductanceis calculated from:whereSC =AC is the actual conductivity in µS/cm0.0191 is a nominal temperature coefficient for KCl solutionsTemp. is the solution temperature in degrees C.The correction factor of 0.0191 (1.91% / °C) for KCl solutions is areasonable approximation for samples containing sodium and chloridesalts (i.e., seawater). For comparison, the table below lists correctionfactors for other solution types.SolutionAC[1 + 0.0191 ∗ (Temp. – 25.0)]Correction factor(%/ o C)5% H 2SO 40.9610% HCl 1.325% NaOH 1.7Dilute NH 31.88KCl salt (default) 1.91NaCl salt 2.1298% H 2SO 42.84Ultrapure water 4.55Sugar solution 5.64Units: microSiemens per centimeter (µS/cm SC)<strong>TROLL</strong> <strong>9500</strong> Operator’s <strong>Manual</strong> 760095110 rev. 007 01/09
Section 12: ConductivityTotal Dissolved Solids (TDS)A factor of 0.65 x specific conductance is used to estimate TotalDissolved Solids (TDS). This was chosen for general applicability.Remember that ions in solution will vary, and this general conversionfactor will not fit all situations exactly. Units: mg/LResistivityThe reciprocal of conductance is resistance. Resistivity is the resistancetimes the cell constant. Resistivity is useful when monitoringpure water. Units: Kohms cmSalinityCalculated from conductivity and temperature using the PracticalSalinity Scale adjusted for low salinities. Units: PSU (Practical SalinityUnits)The original Practical Salinity Scale (1978) was considered valid for arange of 2-42 PSU; “standard seawater” is defined as having a valueof exactly 35. In 1986, there was an adjustment to the scale for betteraccuracy with low salinities. That adjusted scale is considered valid fora range of 0-40 PSU. Above 2 PSU there is no significant differencebetween the two scales. “Fresh” water would typically have valuesbelow 1, and typically very close to 0.Usage Recommendations and CautionsConductivity and TemperatureConductivity is a function of temperature. According to the EPA,temperature variations and corrections represent the largest sourceof potential error in conductivity measurements. A 0.1°C change intemperature can cause a 0.2% change in conductivity.Specific conductance is the conductivity of a substance at 25°C, andmeasurements are usually standardized to 25°C when it is necessaryto compare data. When the temperature of a sample and its conductivityat that temperature are known, the software can extrapolate theconductivity to 25°C.Sensor Care and HandlingSensor RemovalPosition the yoke of the sensor removal tool at the pointwhere the sensor enters the sensor block and pry thesensor upward.Maintenance/Inspection/CleaningsensorremovaltoolCheck the sensor for fouling of the electrodes. If necessary, flush thesensor with water, or swish in a mild detergent solution and rinse withtap water. A swab or soft-bristle brush may be gently used to cleanthe electrodes. Remember that the electrodes are made of graphite,which is soft and easily damaged.StorageStore the sensor dry.ReferencesEaton, A.D., L.S. Clesceri, E.W. Rice, and A.E. Greenberg, eds.,Standard Methods for the Examination of Water and Wastewater,21st edition, Washington, D.C.: American Public Health Association,American Water Works Association, and Water EnvironmentFederation, 2005. Section 2510, Conductivity. Section 2520 B,Salinity - Electrical Conductivity Method.EPA, Methods for Chemical Analysis of Water and Wastes,EPA/600/4-79-020, revised March 1983. Method 120.1, Conductance,Specific Conductance. Approved at 40 CFR Part 136.The International Association for Physical Science of the Ocean(IAPSO) Standard Seawater manufactured by Ocean Scientific Internationalis available in North America from Guildline InstrumentsInc. in Lake Mary, Florida.<strong>TROLL</strong> <strong>9500</strong> Operator’s <strong>Manual</strong> 770095110 rev. 007 01/09
Multi-ParameterWater Quality <strong>TROLL</strong> ®13 Dissolved OxygenWhat is Dissolved Oxygen?The amount of dissolved oxygen (D.O.) in both natural water andwastewater is a function of several parameters. D.O. is highlydependent on temperature and atmospheric pressure. An increasein temperature causes a decrease in the amount of oxygen that candissolve in water. On the other hand, higher atmospheric pressuresresult in higher D.O. values. Salinity is also a factor. Oxygen solubilityis greater in freshwater than in saltwater. There are also chemical andbiochemical processes that affect D.O.Most of the dissolved oxygen in water comes from the atmosphere,but oxygen from the photosynthesis of aquatic plants is also a keysource. D.O. levels in lakes and other surface water will actually followa cyclic or diurnal pattern over the course of a day, rising and fallingas light intensity changes from dawn to dusk.Why Measure Dissolved Oxygen?Most aquatic life requires an average D.O. value greater than 5.0 milligramsdissolved oxygen per liter of water (mg/L) in order to survive.Although the amount of dissolved oxygen in a body of water fluctuatesdue to natural processes, large deviations from the norm are usuallya result of human activity. Changes in D.O. levels are usually theresult of a buildup in organic waste. Organic waste can enter surfacewater from sewage treatment facilities, runoff from agricultural feedlots or domestic areas and from industrial discharge. Organic wastesoften contain nitrates and phosphates. Nitrates and phosphates arenutrients for aquatic plants and algae, stimulating overproductionwhen present in excessive levels. Accelerated growth of bloomsincrease the number of photosynthesizing plants, which temporarilyincreases the amount of dissolved oxygen. However submergedaquatic vegetation eventually experience a reduction in sunlightdue to increased coverage on the surface. This decrease in sunlightleads to a reduction in photosynthesis and eventual death. Bacterialprocesses take over and consume even more dissolved oxygen. Fishand other aquatic species die due to lack of dissolved oxygen. Thistragic process is known as eutrophication.Typical D.O. values100% DO, 0°C, 1 atm, 0 ppm Chlorine* 14.6 mg/L100% DO, 20°C, 1 atm, 0 ppm Chlorine 9.09 mg/L100% DO, 0°C, 0.75 atm, 0 ppm Chlorine 6.77 mg/L100% DO, 20°C, 1 atm, 20 ppm Chlorine 7.35 mg/LSafe level for most aquatic life> 5.0 mg/L* representative of solute concentration<strong>TROLL</strong> <strong>9500</strong> Operator’s <strong>Manual</strong>780095110 rev. 007 01/09
Section 13: Dissolved Oxygen—PolarographicPolarographic Measurement of Dissolved OxygenThe Polarographic Dissolved Oxygen SensorTheory of OperationThe sensor is a Clark-type polarographic sensor consisting of twometallic electrodes in contact with an electrolyte and separated fromthe measurement water by a polymeric membrane. Dissolved oxygenand other gases diffuse through the membrane into the electrolyte.An electric potential is applied to the electrodes, which causes anelectrochemical reaction. Oxygen is reduced at the cathode:O 2+ 2H 2O + 4e – ⇒ 4(OH) –while silver is oxidized at the anode:4Ag + 4Cl – ⇒ 4AgCl + 4e –The resulting current is proportional to the oxygen crossing themembrane. The electric potential is carefully selected so that only thedissolved oxygen is reduced.The concentration of dissolved oxygen is usually reported in milligramsof oxygen per liter of water (mg/L), but the sensor actuallymeasures the partial pressure of dissolved oxygen. Other gases suchas nitrogen, carbon dioxide, and water vapor are also dissolved inthe water. The partial pressure of the oxygen is the fraction of theoxygen multiplied by the total pressure of all the gases. This value isalso a function of water temperature and water salinity. The maximumamount of oxygen that can be dissolved in water at a given atmosphericpressure, water temperature, and salinity (100% D.O.) can becalculated from first principles. D.O. measurements taken in the fieldare then compared to the 100% D.O. value. D.O. measurements ofsurface water are typically less than the 100% D.O. value due to thepresence of biological and chemical processes that consume oxygen.Field measurements are corrected for changes in temperature, airpressure, and salinity.During the electrochemical process dissolved oxygen is consumedwhile silver chloride (AgCl) is deposited on the anode. In time, bothprocesses will adversely affect the stability and accuracy of the D.O.measurements. Depletion of oxygen near the membrane will causereadings to decrease when measuring D.O. in stagnant water. Theuse of a stirrer, or similar mechanism to increase water movement,alleviates this problem.Sensor ConditioningAs soon as the software “recognizes” and displays the D.O. sensorin port 2, powering of the D.O. channel begins. A low-level currentis applied continuously to the D.O. circuitry, resulting in continuouspolarization. This is similar to laboratory instruments for measuringdissolved oxygen, which are always “on.” A certain amount ofconditioning or “warm-up” time is necessary for the sensor to returnaccurate readings during calibration and use.Before calibrating a new D.O. sensor, or a sensor with a new membrane,we recommend that you allow a minimum of two hours forconditioning. For stable long-term performance and faster stabilityduring calibration, we recommend 10 hours of conditioning. If theD.O. sensor is installed when you receive the instrument, it will beconditioned and ready to calibrate. If you remove the sensor, be sureto allow for another period of conditioning before you calibrate.TIP: Testing has shown that 10 hours of conditioning yieldsvery stable long-term performance.Sensor InstallationThe MP <strong>TROLL</strong> <strong>9500</strong> may be shipped with a polarographic D.O. sensorinstalled in port 2. When the sensor is shipped in the instrument, itis pre-conditioned and ready for calibration.If installation is necessary, unpack, fill, install, and condition a polarographicD.O. sensor as follows.Fill the Membrane ModuleNew sensors are shipped with a dry membrane module loosely attached.Cap1. Remove the soft protective caps from themembrane end and the connector end ofthe sensor.MembraneMembranemodule2. Remove the membrane module from the Cathodesensor body and fill with electrolyte as follows: AnodeHolding the membrane module open-end up,position the electrolyte dispenser against the sideof the module without touching the membrane. Fillslowly.TIP: To eliminate air bubbles, tap the side of themodule briskly with your fingernail.3. Insert the sensor into the open end of the membranemodule. To minimize air, some of the electrolyteshould overflow from the open end as the sensor isinserted.o-ringsCap<strong>TROLL</strong> <strong>9500</strong> Operator’s <strong>Manual</strong> 790095110 rev. 007 01/09
Section 13: Dissolved Oxygen—Polarographic4. Thread the membrane module to the D.O. sensor.Be sure the membrane does not leak. You should not seeany drops on the surface. There should be no visible airbubbles.5. Install and condition the sensor as described below. Then you’reready to calibrate.Install the Sensor in the MP <strong>TROLL</strong> <strong>9500</strong>The polarographic D.O. sensor will function properly onlywhen installed in port 2.1. Remove the restrictor or Cal Cup from the front end of the MP<strong>TROLL</strong> <strong>9500</strong>. This allows access to the sensor block shown in thedrawing below.2. Remove any moisture or dirt from the area aroundport 2, then use the sensor removal tool to removethe plug or sensor from port 2. Retain the plug forfuture use.3. Remove any moisture or dirt from the port connectorwith a clean swab or tissue.4. Check lubrication of the sensor o-rings.TIP: The sensor o-rings require generous lubrication beforeinstallation. New sensors will be lubricated at the factory. Ifthe o-rings appear dry, apply a silicone lubricant before installation.5. Handling the sensor by the sides, not the tip, align the mark on theside of the sensor with the mark on the port.Avoid touching the membrane at the tip of the sensor.Contaminants on the membrane can change its propertiesand affect measurements.6. Use the sensor insertion tool to press the sensor into the port untilyou feel it dock with the connector at the bottom. When properlyInstall polarographicD.O.sensor herealignment markPressure/Turbidity(or plug)Temperature• Traditional calibration–2 point: 100% D.O. may be calibratedeither in air or in water. 0% D.O. is calibrated in an oxygensensorremovaltoolinserted a small gap (width of the sensor removaltool) remains between the widest part of the sensorand the instrument body, for ease of removal.7. Turn the sensor “on” and condition it, as describednext.Condition a Newly Installed SensorCondition a new sensor, or one with a new membrane, as follows:1. Fill and install the sensor as described above.2. Connect the MP <strong>TROLL</strong> <strong>9500</strong> to a PC and establish a connectionin Win-Situ 4 or Pocket-Situ 4.3. Select the MP <strong>TROLL</strong> <strong>9500</strong> in the Navigation tree. All installed sensorswill be displayed.Powering of the D.O. sensor begins as soon as the software recognizesthe D.O. sensor and displays it in the Navigation tree. Thisstarts the conditioning process.TIP: If you plan to calibrate 100% D.O. in air, condition thesensor in a moist environment at ambient pressure—theloosely attached Cal Cup with a small amount of clean water is ideal.If you will be calibrating 100% D.O. in water, condition the sensor dry.We recommend that you allow the sensor to condition for 2-10 hoursbefore calibrating. Testing has shown that 10 hours of conditioningyields very stable long-term performance.CalibrationOverviewsensorinsertiontoolTIP: It is not necessary to maintain the computer connection;conditioning continues as long as the sensor is installed.Several options are available for calibrating a polarographic sensor.• Quick Cal: Calibrates all Basic sensors (pH, ORP, polarographicD.O., conductivity) at the same time with one convenient solution.This is a 1-point 100% D.O. calibration in air at ambient pressure.• Traditional calibration–1 point: 100% D.O. may be calibratedeither in air (saturated with water) at ambient pressure, or in water(saturated with air—for example, using a bubbler). The watermethod is generally more accurate, as it better represents actualfield D.O. measurement conditions.<strong>TROLL</strong> <strong>9500</strong> Operator’s <strong>Manual</strong> 800095110 rev. 007 01/09
Section 13: Dissolved Oxygen—Polarographicdepleted solution such as sodium sulfite or nitrogen-saturatedwater. A 2-point calibration is recommended• when you expect to measure very low D.O. values (< 5 mg/L),• when required by Standard Operating Procedures.Nominal vs. StableTo shorten the calibration time, you have the option to accept thecalibration when “Nominal” stability is achieved. If the early value isaccepted, the calibration point will be designated “USER SET” in thecalibration report. If the calibration report indicates that calibrationwas performed through to stability then the instrument will operate asintended by In-Situ’s quality standards.Calibration Solutions & <strong>Equipment</strong>100% D.O. calibrations may be performed in water saturated with air,or in air saturated with water. Deionized water is available from In-SituInc., but any clean water may be used. In-Situ’s bubbler calibration kitis designed for an efficient water calibration.An oxygen-depleted solution is used to calibrate the 0% D.O. Sodiumsulfite is available from In-Situ Inc. For a cleaner calibration, nitrogensaturatedwater may be used.Recommended Calibration FrequencyYour own experience is the best guide to how often the polarographicD.O. sensor will benefit from recalibration under conditions of normalusage. Refer to the general guidelines under “How Often to Calibrate”in Section 10, and the tech note on “Instrument Calibration.”Until a new polarographic sensor has been thoroughly conditioned, itmay require more frequent calibration. In the absence of other indications,a calibration should be performed every 2-4 weeks.In addition, the polarographic D.O. sensor should be conditioned for2-4 hours and recalibrated in the following circumstances:• after cleaning the sensor,• after replacing the membrane module,Q:A:I did a Quick Cal. Why should I recalibrate D.O.?The D.O. Quick Cal, especially if done through to stability,can provide accurate measurement results. However, someprocedures require a look-up table for the stimulus at a giventemperature and pressure. This can be done in the traditionalD.O. calibration. Also, better measurement results will beobtained when the 100% calibration is done in water saturatedwith air. This procedure is not provided for in Quick Cal. In addition,the traditional calibration provides for a 0% (0 ppm, 0 mg/L)calibration, which is recommended when measuring very lowD.O. values.• when taking measurements at an elevation different from that atwhich the sensor was last calibrated.Dissolved Oxygen Calibration TipsThe following discussion may help you to obtain the best results fromthe polarographic D.O. calibration.• Air or Water? The software provides two options for conducting a100% D.O. calibration:∗ in air (saturated with water). This is the condition during a QuickCal in the inverted Cal Cup with the sensor membrane exposedto air, temperature sensor submerged, and Cal Cup vented tothe atmosphere.∗ in water (saturated with air). In-Situ’s bubbler calibration kitprovides everything needed to create a vigorous bubbling actionto insure air-saturated water. The Cal Cup is not used.Since dissolved oxygen measurements are typically made in water,calibrating in water will often yield better results. When calibrated inair, the membrane’s behavior in water must be estimated.• The D.O. calibration procedure is very sensitive to changes intemperature. Ideally, it should be done in an area protected fromdirect sunlight and away from ventilation ducts.• The nature of the sensor membrane influences the response. Besure to note the membrane thickness before starting the calibration.(If no thickness is indicated, the membrane is 1-mil Teflon.)Membrane thickness is more important with a 100% calibration inair.Dissolved Oxygen Quick CalThe procedure to Quick Cal the polarographic D.O. sensor, along withother Basic sensors, is in Section 3, Getting Started. This is a singlepoint100% calibration in air (saturated with water).The following traditional calibration is recommended for use when• the user is required to enter a specific stimulus at the calibrationtemperature and pressure,• calibration in water is preferred,• a 0% calibration point is needed.Traditional Dissolved Oxygen Calibration ProcedureYou may select a 1-point or a 2-point calibration. The first point (100%saturation) may be taken in air or in water.Prepare the MP <strong>TROLL</strong> <strong>9500</strong> for water or air calibration as describedin Steps 1-6 on the following page.<strong>TROLL</strong> <strong>9500</strong> Operator’s <strong>Manual</strong> 810095110 rev. 007 01/09
Section 13: Dissolved Oxygen—PolarographicPreparation for 100% D.O. Calibration in WaterThe bubbler cal kit for the Polarographic D.O. sensor comes with(1) Battery-powered air pump and 2 alkaline D-cells, (2) Bubblercup with aquarium stone, tubing, check valve and pinch valve, (3)Grey PVC adapter to support the <strong>TROLL</strong> <strong>9500</strong> in the top of thebubbler cup.1. Install the batteries in the portable air pump as shown in thediagram on the inside of the lid.2. Fill the bubbler container almost to the top with clean water. Theoptimum amount depends on the volume of the sensors installedin the MP <strong>TROLL</strong> <strong>9500</strong>.TIP: Tap water is fine, unless it is high in salinity. It is easierto achieve 100% oxygen saturation in low-salinity water.Distilled water is readily available and works well.3. About 10 minutes before calibration, turn on the bubbler. Regulatebubbling with the pinch valve. For best results, run at the fullflow rate to achieve saturation; after 10 minutes you can use thecontrol valve to match the water turbulence conditions expectedin the field.4. Before beginning the calibration procedure, note the membranethickness stamped on the membrane module.5. With the D.O. sensor installed and plugs or sensors in theother sensor ports, rinse the front end of the MP <strong>TROLL</strong> <strong>9500</strong>thoroughly in clean water to remove contaminants and traces offluids used for earlier calibrations.6. When ready to calibrate, place the adaptersecurely in the top of the bubbler housingand insert the front (sensor) end of the MP<strong>TROLL</strong> <strong>9500</strong> into the adapter.• Insure the D.O. sensor is not in theaeration path. Rotate as necessary toprevent air bubbles from collecting onthe membrane surface.• Insure the temperature sensor is submerged at least 0.5” (12mm) in the aerated water.Allow a few minutes for the temperature to stabilize,especially if you plan to enter a temperature dependentvalue from a look-up table.6Preparation for 100% D.O. Calibration in AirTIP: Before beginning the calibration procedure, checkthe side of the membrane module for the membranethickness.1. With the D.O. sensor installed and plugs or sensors in theother sensor ports, rinse the front end of the MP <strong>TROLL</strong> <strong>9500</strong>thoroughly in clean water to remove contaminants and traces offluids used for earlier calibrations.2. Dry the D.O. sensor membrane by shaking the probe and/orgently wiping with a soft swab or the corner of a tissue.3. Rinse the empty Cal Cup and attach it to the MP <strong>TROLL</strong> <strong>9500</strong>.Thread the Cal Cup onto the body until it is seated against theo-ring, then back off slightly to avoid overtightening.4. Invert the <strong>TROLL</strong> with Cal Cup attached and remove the blackend cap from the Cal Cup.5. Gently fill the Cal Cup with clean water until the temperaturesensor is completely covered and the membrane at the tip of theD.O. sensor is in air. If any water splashes onto the membrane,gently blot the center of the membranewith a clean cotton swab or the corner ofa soft lint-free tissue.6. Loosely attach the end cap to the CalCup. For proper venting, a small hole inthe threads of the cap should be at leastpartly visible to achieve ambient pressureconditions.You may wish to use a clamp or othersupport to maintain the <strong>TROLL</strong> <strong>9500</strong> inthis inverted position.Allow a few minutes for the temperature to stabilize,especially if you plan to enter a temperature dependentvalue from a look-up table.6<strong>TROLL</strong> <strong>9500</strong> Operator’s <strong>Manual</strong> 820095110 rev. 007 01/09
Section 13: Dissolved Oxygen—Polarographic7. If not already connected, connect the MP <strong>TROLL</strong> <strong>9500</strong> to a PC,launch the software, and “find” the device. Win-Situ screens areillustrated here. The Pocket-Situ interface is similar, with the Navigationtree at the top and the Information pane below it.8. Select the MP <strong>TROLL</strong> <strong>9500</strong> in the Navigation tree.The software will automatically detect and display the installed sensors.9. Select Dissolved Oxygen in the Parameters list.The sensor serial number (SN) and recent calibration information isdisplayed, as shown in the screen below.After dealing with barometric pressure the D.O. Calibration Wizarddisplays a screen like the one below:12 1314151691012. Select the number of calibration points.1 point—100% D.O.2 points—100% and 0% D.O.13. Select the membrane type (stamped on membrane module, if not,it’s 1-mil Teflon). If calibrating in water, the membrane thickness isnot crucial. When calibrating in air, be sure the correct membranetype is selected.14. Select Air or Water as the medium for the first calibration point.10. Select Calibrate.11. Before the DO Calibration Wizard starts, you will be asked howyou want to handle barometric pressure. See the box below.15. Select the stimulus at saturation:• Default—This value is calculated by the software at the currenttemperature and barometric pressure.• User Set—Enter a value from a look-up table if required.Barometric pressure is important in converting measurement of D.O.concentration to percent saturation, and a value is required for accuratecalibration. If the <strong>TROLL</strong> <strong>9500</strong> cable is vented, an accurate barometricpressure value can be read from the onboard barometric pressure sensor. Ifthe <strong>TROLL</strong> cable is non-vented, then a barometric pressure value should beentered manually.11Do one of the following:• If the <strong>TROLL</strong> <strong>9500</strong> is on vented cable now and will take measurementsusing vented cable, click No — and you may want to check the “Don’task me this again” box.• If the device is on vented cable now but will take measurements usingnon-vented cable, click Yes. In the Edit Barometric Channel screen,check the box indicating non-vented cable for measurements but ventedcable for calibration/programming.• If the device is on non-vented cable now and will take measurementson non-vented cable, click Yes. In the Edit Barometric Channel screen,check the box indicating non-vented cable for measurements and enter abarometric pressure value. For help in supplying information if the cableis not vented, see Section 9, Monitoring Barometric Pressure.<strong>TROLL</strong> <strong>9500</strong> Operator’s <strong>Manual</strong> 830095110 rev. 007 01/09
Section 13: Dissolved Oxygen—Polarographic16. Click Next to continue. A screen like this will be displayed:• Current temperature and barometric pressure are shown; thesevalues are used to calculate the stimulus.TIP: If the calibration stimulus was entered from a look-uptable at step 15 and the temperature is not as expected, youmay select Stop, then Back to retrieve the Setup page andre-enter the User Set stimulus.1718. When readings have stabilized (or you click to Accept the Nominalresult), the calibration will advance automatically.If doing a 1-point calibration, go to step 20.For a 2-point calibration, the Wizard displays a screen similar tothe one shown below and waits for you to situate the sensor inoxygen-depleted medium—either the Cal Cup filled with sodiumsulfite solution, or a nitrogen-saturated water bath.This time, theD.O. sensor membrane should be completely immersed in solution,as well as the temperature sensor.17. Select Run to begin stabilization for the first calibration point.The display will continuously update as readings are taken andcompared against the stabilization criteria.• Status indicators:NOT TESTED is displayed until you begin the calibration byselecting Run.UNSTABLE indicates the sensor response does not meet thecriteria for a valid calibration point.NOMINAL indicates the sensor deviation meets early stabilizationcriteria.The Accept button becomes available when nominal stability isachieved. You may accept the early value, or wait for completestability. If you accept the early value, the status will bedesignated “USER SET” in the calibration report. (For more oncalibration reports, see “Calibration History” in Section 10.)STABLE is displayed when the readings have stabilized sufficientlyto take a valid calibration point. The calibration proceedsautomatically to the next screen.• Sensor Reading: The current sensor response in nanoAmps.• Sensor Deviation: Change in response between the last 2 readings.This enables you to follow the progress of the stabilization,but the deviation from the previous reading is not necessarily thebest indicator of stability as the software is looking at longer-termtrends.19Allow about 15 minutes for the sensor to stabilize in the medium.19. Select Run to begin the stabilization for the 0% calibration point.Controls and status indicators are the same as for the first calibrationpoint (step 17).In true 0% conditions, the sensor reading will be 10 nA orless. If the sensor needs maintenance or there is oxygen inthe medium, readings will be higher than 10 nA andcomplete stability will never be reached. If an accurate 0% calibrationis important to your application, do not accept Nominal. Cancel thecalibration, perform sensor maintenance and/or check the conditions,and repeat the calibration.<strong>TROLL</strong> <strong>9500</strong> Operator’s <strong>Manual</strong> 840095110 rev. 007 01/09
Section 13: Dissolved Oxygen—Polarographic20. When readings have stabilized (or you Accept the Nominalvalue), the final screen is displayed. The calculated sensor slopeand offset are shown.Options for storing the sensor:We recommend you leave the D.O. sensor installed in the instrument;this will assure you are able to take fast D.O. measurements ondemand. A little water (distilled, deionized, or tap) or a damp sponge inthe Cal Cup will keep the sensor membrane moist.Remember that, as long as the D.O. sensor is installed, it is beingconditioned.If the sensor is removed from the instrument and then re-installed,conditioning will begin as soon as the sensor is detected by the instrumentand displayed in the software.Sensor Slope and Offset21. Select Finish to program the sensor with the new calibration coefficients.The values will be written to the sensor and you will beasked if you want to see the calibration report.TIP: You can look at the calibration report right aftercalibrating, or at any time. See “Calibration History” inSection 10 for details.Rinse the sensor and front end of the instrument very thoroughly aftercalibrating in sodium sulfite solution. A good way to do this is to fill theCal Cup with water, attach to instrument, and shake vigorously. Thismay need to be done a couple of times.TIP: The calibration solution may be flushed down the drainwith running water, or saved in a separate container andused to rinse the sensors the next time you calibrate with thesame solution.After everything is thoroughly rinsed, the D.O. sensor is ready se.20The slope of a properly functioning sensor as calculated during thecalibration process will typically be in the following ranges, dependingon the membrane thickness:1-mil membrane: between 30 and 67 nA/(mg/L)2-mil membrane: between 15 and 34 nA/(mg/L)If the calculated slope is much outside the stated range, the sensormay need maintenance. Refer to “Sensor Care and Handling” below.The default offset for Quick Cal and 1-point calibrations is 2 nA.Offsets for 2-point calibrations should fall under 10 nA.Units and Calculated MeasurementsFour units are available for dissolved oxygen:TIP: To change unit preferences: In Win-Situ, selectPreferences on the Options menu. In Pocket-Situ, select theHome site, then tap Setup in the command bar.• Oxygen concentration in milligrams of oxygen per liter of water(mg/L). Since a liter of pure water weighs 1000 grams, and amilligram is 1/1000 of a gram, this is equivalent to ppm (parts permillion).Q:A:Why does it take so long for the D.O. 100% to stabilize inair?Paying attention to several factors can assure the shorteststabilization times possible within the stability algorithm:• The sensor membrane is perfectly dry.• The ambient temperature is stable.• The temperature sensor is submerged.• The sensor has been fully conditioned.If these conditions are met, the sensor response should stabilizein 6-15 minutes.• Oxygen concentration in micrograms of oxygen per liter of water(µg/L).• Oxygen concentration in microMolar (µmol/L), = mg/L x 31.25• Oxygen saturation in % —100% D.O. being the maximum amountof oxygen that can be dissolved in water at a given atmosphericpressure, water temperature, and salinity. % saturation output isautomatically corrected using the <strong>TROLL</strong> <strong>9500</strong>’s temperature,conductivity, and barometric pressure values (from a baro sensoron vented cable or from a user-entered input). If no conductivitysensor is present, salinity is assumed to be zero.<strong>TROLL</strong> <strong>9500</strong> Operator’s <strong>Manual</strong> 850095110 rev. 007 01/09
Section 13: Dissolved Oxygen—PolarographicUsage Recommendations and CautionsThe amount of oxygen that can be dissolved in water decreases athigher temperatures and decreases with increasing altitude (i.e., asbarometric pressure drops) and salinity. In other words, as water becomeswarmer and saltier, it can hold less and less dissolved oxygen.During tests that include the D.O. channel, the MP <strong>TROLL</strong> <strong>9500</strong>automatically measures barometric pressure and temperature forcompensation of D.O. readings.The barometric pressure value at the time of calibration is stored inthe sensor and will be used to correct D.O. readings for weatherinducedpressure fluctuations taken at the same relative barometricpressure as the calibration. However, the large changes in barometricpressure due to changes in elevation are best accommodated by performinga recalibration. If you calibrate at sea level, for example, anduse the instrument in the mountains, you should perform a recalibrationat the new altitude.Be sure to supply a barometric pressure value to correctlycalculate dissolved oxygen measurements if the sensor willbe attached to suspension wire or non-vented cable. Thiscan be done during calibration or prior to setting up a test.To assure you are able to take fast D.O. measurements on demand, itis best to leave the D.O. sensor installed in the MP <strong>TROLL</strong>. This takesfull advantage of the conditioning and polarization that was accomplishedduring calibration. After replacing the <strong>TROLL</strong> <strong>9500</strong> batteries,be sure to power the sensor for an hour or two before use, especiallyif the batteries were out for a while.During the first day, some drift is to be expected. After 24 hours or so,the D.O. values can be expected to stabilize.The D.O. sensor, like the other water-quality sensors, has been testedto 350 psi pressure (246 m, 807 ft). We recommend gradual submersionand retrieval—no faster than 4 ft per second.StirringPolarographic D.O. measurements drop in very stagnant water due todepletion of oxygen next to the membrane. A slight perturbation to thesystem will cause the D.O. measurements to return to normal.Stirring is not necessary for a hand-held instrument, an instrumentattached to a boat or floating object, or in any other situation wherethe water is moving.Q:A:When do I need to stir and when can I skip it?Use a stirrer for best results when measuring D.O. in still orstagnant water.If the water (or the person holding the instrument) is movingat all, you can probably safely skip the stirring. Any watermovement, as for example when the instrument is hand-held,eliminates the need for the stirrer.lake that has no underwater currents. If the wind is blowing and wavesare slightly moving the cable, then stirring is probably not necessary.Attaching the StirrerInstall the stirrer accessory on the MP <strong>TROLL</strong>9000 as follows:1. Remove the nose cone from the MP <strong>TROLL</strong><strong>9500</strong> and set it aside.2. Screw the top of the stirrer (propeller end) tothe stainless steel restrictor in place of thenose cone.Starting the StirrerThe stirrer is powered by two alkaline D-cells (installed). To start the motor, tightenthe end cap.The magnetic stir bar in the propellercompartment will start to spin. The stir baris protected by a guard plate that may beremoved for cleaning if necessary.Stirrer← →off onBodyRestrictorStirrer installedin place of noseconePropellercompartmentMotorcompartmentBatterycompartmentEnd capTIP: If the stir bar does not start spinning, try giving it agentle nudge by sliding a narrow tool such as a screwdriveror key between the protective bars of the guard plate.To turn the stirrer off, back off the end cap until the stir bar stops spinning.Stirring is recommended if the instrument is anchored to a fixed structurein stagnant conditions—for example, attached to a pier in a calm<strong>TROLL</strong> <strong>9500</strong> Operator’s <strong>Manual</strong> 860095110 rev. 007 01/09
Section 13: Dissolved Oxygen—PolarographicSensor Care and HandlingThe D.O. sensor kit includes the following items for routine maintenanceof the D.O. sensor:• extra membrane module• electrode filling solution (KCl electrolyte)• cleaning solution and brush• polishing strips (for cathode)• storage bottle• o-ring lubricantSensor RemovalPosition the yoke of the sensor removal tool at the pointwhere the sensor meets the sensor block and pry thesensor upward.Always handle the sensor by the sides. Avoid touchingthe membrane at the sensor tip.Maintenance/InspectionInspect the sensor and membrane if readings begin to drift.• Check for discoloration of the elec trodes due to silver chloride(AgCl) deposition.• Inspect the membrane for integrity of the surface, for the presenceof algal growth or other contaminants, for crystallization that mayindicate a leak in the membrane, and to ensure no air bubbles aretrapped under the membrane.Cleaning the ElectrodesRemove the membrane module and clean the electrodes as follows:Cathode. Use a polishing strip to buffthe platinum cathode until it is shiny. Thisremoves any deposits, increasing thechemically active surface of the electrodefor a stronger D.O. signal.Anode. If the sensor appears to be excessivelydiscolored from its original mattegrey color, clean the anode with ammoniaand a soft brush. Extreme discolorationmay be removed by soaking for a half-hourin ammonia before cleaning with a brush.The surface of the anode should appearuniform, but not necessarily mirror-like.MembraneMembrane moduleCathodeAnodePolarographicDissolvedOxygenSensorsensorremovaltoolRegular cleaning will prevent pitting of the anode surface, causedby accumulated silver chloride deposition. Severe pitting cannot beremoved; the sole remedy is to replace the sensor.After cleaning, rinse thoroughly and shake to dry. Then fill and attacha new membrane module as follows.Replacing the Membrane ModuleThe D.O. sensor performs best in clean water. In environments withhigh organic content, the membrane can become fouled. Rips, tearsand other damage will also affect membrane performance. For bestresults, replace the membrane when the slope and offset calculatedduring calibration change dramatically.The current applied is so small that the electrolyte solution can beexpected to last longer than the membrane in most applicationsTo replace a membrane module:1. Make sure the area around port 2 is free of dirt and moisture, thenremove the sensor. Remove and discard the used membranemodule.2. Inspect and clean the sensor as needed (see above).3. Fill a new membrane cap with electrolyte and attach it to the sensor.Refer to “Fill the Membrane Module” earlier in this section.4. Install and condition the sensor. Refer to “Condition a NewlyInstalled Sensor” earlier in this section.Remember to condition the sensor for at least 2 hours,preferably 10 hours, before recalibrating with a newmembrane. Even with all visible air bubbles removed, acertain amount of gas will be trapped under the membrane. Theconditioning period will remove this excess oxygen.Sensor LifeThe sensor body may be expected to last indefinitely so long asthe silver coating is not rubbed off the anode during cleaning. Themembrane module should be inspected regularly and replaced whenit shows wear or damage and when the slope and offset calculatedduring calibration change dramatically.StorageShort-Term Storage (up to a two weeks)Store assembled with membrane immersed in water. A suitable storagebottle is included in the sensor box.o-rings<strong>TROLL</strong> <strong>9500</strong> Operator’s <strong>Manual</strong> 870095110 rev. 007 01/09
Section 13: Dissolved Oxygen—PolarographicLong-Term StorageRemove the membrane module, rinse with deionized water, cap andstore dry.ReferencesEaton, A.D., L.S. Clesceri, E.W. Rice, and A.E. Greenberg, eds., StandardMethods for the Examination of Water and Wastewater, 21stedition, Washington, D.C.: American Public Health Association,American Water Works Association, and Water Environment Federation,2005. Section 4500-O G, Oxygen (Dissolved), MembraneElectrode Method.EPA, Methods for Chemical Analysis of Water and Wastes,EPA/600/4-79-020, revised March 1983. Method 360.1, Oxygen,Dissolved, Membrane Electrode. Approved at 40 CFR Part 136.<strong>TROLL</strong> <strong>9500</strong> Operator’s <strong>Manual</strong> 880095110 rev. 007 01/09
Section 13: Dissolved Oxygen—OpticalOptical Measurement of Dissolved OxygenThe RDO Optical Dissolved Oxygen SensorThe In-Situ RDO ® optical dissolved oxygen sensor measures dissolvedoxygen using the principle of “dynamic luminescence quenching.”Certain molecules, called “lumiphores,” fluoresce when excitedby light of a specific wavelength. Oxygen molecules act to quench thisfluorescence. The lumiphores in the sensor are embedded in a gaspermeablesensing foil in a replaceable cap.The sensor optics include a lens, blue LED and filter, red LED andfilter, and a photodetector. When the blue LED emits light, the sensingfoil emits red photons; the presence of oxygen in the foil causes areduction in red light detected by the photodiode. The phase differencebetween the blue excitation light and the returned red light ismeasured, and the result is used to compute dissolved oxygen.This method measures the “phase” (or delay) of the returned signal,and is thus based on the “lifetime” rather than the “intensity” of theluminescence.The RDO Sensor and SalinityUnlike an electrochemical cell, the RDO sensor does not respond tochanges in salinity. Since the absolute solubility of oxygen is lowerin saline water, it is advantageous to compensate DO concentrationreadings (µg/L, mg/L, µmol/L) to ensure that the sensor accuratelyreports the concentration of dissolved oxygen in the presence of significantsalinity. This can be accomplished by storing a salinity value inthe sensor before taking measurements. The compensation algorithmis applied internally before concentration is reported. The degree ofcompensation is minimal at very low salinities, and several percent ofreading at oceanic salinity levels.The software prompts for a salinity value when you add a test. Thevalue can be changed at any time by selecting the RDO sensor in theNavigation tree and clicking Edit, then “Edit RDO Salinity Value.”Sensor InstallationYou will need—• <strong>TROLL</strong> <strong>9500</strong> water quality instrument• Alkaline batteriesAlternatively use Saft LSH-20 3.6V lithium D cells. Use ofany other lithium battery will void the warranty of the RDOsensor and the <strong>TROLL</strong> <strong>9500</strong>.Comparison to Polarographic D.O. SensorThe RDO optical dissolved oxygen sensor offers several advantagesover the more traditional electrochemical cell. Its solid-state designdoes not use membranes, filling solution, or other consumables. Thesensor does not consume oxygen, thus it does not require flow pastthe sensor for measurement of DO. It does not require conditioningbefore use. It exhibits very little drift, therefore it does not requirefrequent calibration. In the absence of biofouling, it does not needfrequent routine maintenance.• Latest version of <strong>TROLL</strong> <strong>9500</strong> firmware—this comes loaded in anew instrument, or is available with the download of new softwareat www.in-situ.com• RDO sensor package, with• Latest version of Win-Situ 4/ Pocket-Situ 4 software—this isshipped on a CD with a new <strong>TROLL</strong> <strong>9500</strong> instrument, or is availableat www.in-situ.com.• <strong>TROLL</strong> Com communication cable• Desktop/laptop PC or RuggedReader ® handheld PCUnpack the RDO Cable connect SensorThe RDO cable connect sensor arrives installed in a 3-part adapter/restrictor/nose cone assembly. Remove the black restrictor and nose<strong>TROLL</strong> <strong>9500</strong> Operator’s <strong>Manual</strong> 890095110 rev. 007 01/09
Section 13: Dissolved Oxygen—Opticalcone from the sensor and adapter assembly.AdapterRestrictor4. Align the arrow on the cap with the index mark on the sensor andfirmly press the cap onto the sensor, without twisting, until it sealsover the probe body.Keep the cap in its sealed packaging until ready to install it.Make sure that the o-ring is not pinched or rolled inside the cap.The cap’s lifetime is 1 year after the first reading has beentaken. Install by the date printed on the packaging.INstalling the RDO SensorRDO sensorNose coneThe soft Cal Cup insert enables calibration of the basic sensors whenthe RDO sensor is installed. It contains• An extra screw for the adapter plate• A sponge to create a moist environment for temporary storageof installed sensors that need to be kept wetUnpack the RDO Direct connect Sensor1. If necessary, install batteries in the <strong>TROLL</strong> <strong>9500</strong> instrument.Please exercise great care in handling, installing, andshipping lithium batteries. Refer to the instructions, cautionsand MSDS packed with the batteries.2. Remove the standard restrictor or Cal Cup from the <strong>TROLL</strong> <strong>9500</strong>instrument (if attached). This allows access to the sensor block.3. Determine the installation port(s) for the RDO sensor. For thecable connect, choose port 1 or 3. For the direct connect, youmust choose ports 2 and 3 (with the connector pins in port 3).The RDO direct connect sensor ships in a box as shown below:Lens wipeSensor capCable ConnectDirect ConnectRDO sensorInstruction sheet4. Use the Sensor Removal tool to remove the plug or existing sensorfrom the appropriate port. Port 1 is normally easier to access.TIP: If installing in port 3, you may wish to remove the port 2sensor temporarily (if installed).5. Attach the RDO Sensor to the <strong>TROLL</strong> <strong>9500</strong>:Installing the RDO Sensor CAP1. Remove the red protective dust cap from the sensor and save it for later use.Protective dust capSensor cap2. Use the supplied lens wipe to clean the lens of the sensor, if necessary.a. Remove the soft cap from the connector end of the directconnect RDO sensor. Attach the direct connect sensor andany other remaining sensors (in ports 1 and 4), if applicable.Proceed to step 6.b. For the cable connect sensor, insert the front end of the <strong>TROLL</strong><strong>9500</strong> instrument through the large hole in the adapter, alongsidethe RDO sensor.3. Remove the RDO sensor cap from its shipping sleeve.<strong>TROLL</strong> <strong>9500</strong> Operator’s <strong>Manual</strong> 900095110 rev. 007 01/09
Section 13: Dissolved Oxygen—Opticalc. Press until the instrument’s sensor block surface is flush withthe adapter plate surface. Align the RDO sensor between sensorports 1 and 2. Align the open hole for the RDO sensor cablebeside port 1. Refer to the drawing below.d. Tighten the adapter screw with a Phillips head screwdriver, notoverly tight.e. Feed the short black cable up through the open hole, so it is onthe same side of the adapter plate as the <strong>TROLL</strong> <strong>9500</strong> sensorblock (refer to the drawing below).f. Remove the soft cap from the connector end of the RDO sensorcable harness. Align the mark on the side of the sensor with thealignment mark on the selected port (1 or 3). Or just visuallyalign the 3-pin connector on the cable harness with the connectorin the selected port.g. Press the cable harness into the port until you feel it dock withthe con nector. When properly inserted a small gap (width of thesensor removal tool) remains between the instrument body andthe widest part of the cable harness, for ease of removal.Connected to the <strong>TROLL</strong> <strong>9500</strong>, the RDO sensor looks like this:6. Remove the RDO sensor cap from its shipping/storage sleeve.Align the arrow with the index mark and firmly press the cap ontothe sensor, without twisting, until it seals over the probe body.Make sure that the o-rings are not pinched or rolled between thecap and the sensor.Avoid allowing moisture, including atmospheric humidity,inside the cap. Keep the cap in its sealed packaging untilyou are ready to install it. Install promptly. Make sure that o-ringgrooves are dry and the o-ring is not rolled or pinched inside the cap.The cap’s lifetime is 1 year after the first reading has beentaken with the <strong>TROLL</strong> <strong>9500</strong> instrument. Install by the dateprinted on the packaging.7. Perform a 2-point calibration on the sensor, as described below.8. Attach the restrictor and nose cone. (If a turbidity sensor orturbidity wiper are installed on the cable connect model, pull theslack in the adapter cable up against the probe so that it does notinterfere with wiper movement or turbidity readings.)Cable connectQ:A:<strong>TROLL</strong> <strong>9500</strong>sensor blockRDOadapterplateNot to scaleTop ofRDOsensorPressure/TurbidityAlignmentmarkPull cable throughthis holeWhy is there no Quick Cal option for the RDO sensor?Quick Cal solution is used to calibrate sensors that are knownto drift and otherwise lose measurement accuracy on a timescale shorter than desired for field use. Thus a Quick Cal providesa simple and potentially less accurate means to calibratethe sensor but will improve the sensor accuracy as compared tothe state to which it may have drifted. It is less accurate but alsoless costly than removing the instrument to a laboratory settingto perform traditional multi-point calibrations.Since the RDO sensor does not drift appreciably in media voidof biofouling, there is nothing to be gained from a Quick Cal. Atraditional 2-point laboratory calibration after cleaning or changingthe sensor cap is adequate. If biofouling is detected, morefrequent cleaning and subsequent calibration may be needed.Direct connect9. If using the cable connect sensor, pull the slack in the adaptercable up against the probe so that it does not interfere with wipermovement or turbidity readings.CalibrationOverviewNominal vs. StableTo shorten the calibration time, you have the option to accept thecalibration when “Nominal” stability is achieved. If the early value isaccepted, the calibration point will be designated “USER SET” in thecalibration report. If the calibration report indicates that calibrationwas performed through to stability then the instrument will operate asintended by In-Situ Inc.’s quality standards. Formore on calibration reports, see Section 10 ofthis manual.TIP: During calibration, salinity is set to0 PSU. A salinity value stored in thesensor is restored after calibration is complete.For more information on storing a fixed salinityvalue in the sensor, see The RDO Sensor andSalinity earlier in this chapter.<strong>TROLL</strong> <strong>9500</strong> Operator’s <strong>Manual</strong> 910095110 rev. 007 01/09
Section 13: Dissolved Oxygen—OpticalCalibration Solutions100% DO calibration is performed in water saturated with air. For bestresults, use the In-Situ RDO Bubbler Cal kit (Cat. No. 0048580).0% DO calibration is performed in an oxygen-depleted solution. Sodiumsulfite (Na 2SO 3, Catalog No. 0017670) is available from In-SituInc. Bubbled nitrogen may be used; in this case allow plenty of timefor the oxygen to be completely purged from the water.Recommended Calibration FrequencyCalibration frequency is more predictable than with electrochemical DOsensors, since the sensor does not drift appreciably. If the foil is not mechanicallydamaged or removed, calibration can last three months or more.TIP: For best results, check the RDO sensor several timesper year in 100% air-saturated water.Traditional 2-Point CalibrationIdeally, the RDO sensor should be calibrated under stable and controlledconditions, like those found in a laboratory setting. However,field calibration can also be performed. Calibration solutions should beclose in temperature to the sample matrix.One or two calibration points can be taken. If only one point is taken,the software uses the results of a previous calibration for the other point.Allow 5-10 minutes for temperature and oxygen equilibration.TIP: The equilibration time depends on the condition of thewater with respect to temperature and exposure to air.2. Connect the <strong>TROLL</strong> <strong>9500</strong> to a PC and establish a connection inWin-Situ 4 or Pocket-Situ 4. Win-Situ screens are illustrated here.The Pocket-Situ interface is similar, with the Navigation tree at thetop and the Information pane below it.3. Select the <strong>TROLL</strong> <strong>9500</strong> in the Navigation tree. The software willautomatically detect and display the installed sensors.4. Select Rugged Dissolved Oxygen in the Parameters list.Information on the RDO sensor is shown, including its serial number(SN), the foil batch number, and recent calibration information,as shown in the large screen at the bottom of the page.5. Select Calibrate.6. Before the RDO Calibration Wizard starts, you will be asked howyou want to handle barometric pressure. See the sidebar onpage 93.A 2-point calibration (100% and 0%) is recommended• When you expect to measure very low DO values (< 5 mg/L),• When required by Standard Operating Procedures,• After replacing the sensor caplOxygen Saturation Point1. Submerge the RDO sensor in a container of clean water aeratedwith the In-Situ bubbler. Ensure that the sensor is completelysubmerged and the sensor cap is not directly in the bubble stream.Full Screen buttonTIP: To see all of the informationpane, you can clickthe “Full Screen” button onthe Win-Situ toolbar.45Device clock<strong>TROLL</strong> <strong>9500</strong> Operator’s <strong>Manual</strong> 920095110 rev. 007 01/09
Section 13: Dissolved Oxygen—OpticalBarometric Pressure OptionsCable venting is essential to obtain accurate measurements, and thesoftware cannot tell if the cable is vented, so please take a momentto supply this information. Do one of the following:• If the <strong>TROLL</strong> <strong>9500</strong> is on vented cable now and will be deployedon ented cable, click No — and you may want to check the“Don’t ask me this again” box.• If the device is on vented cable now but will be deployed onnon-vented cable, click Yes. In the next screen, check the boxindicating non-vented cable for deployment but vented cable forcalibration/programming.• If the device is on non-vented cable now and will be deployed onnon-vented cable, click Yes. In the next screen, check the boxindicating non-vented cable for deployment and enter a barometricpressure value.For help, see Section 9, Monitoring Barometric Pressure.7. Three calibration options appear. Select the first or second option:• Calibrate: Starting from values stored in the sensor (user-set orfactory defaults) for the 0% and 100% calibration, this allows theuser to redo one or both calibration points• Restore defaults, then calibrate: Restores factory defaults forboth 0% and 100%, then allows the user to redo one or bothcalibration points.• Restore defaults, don’t calibrate: Restores factory defaults forboth 0% and 100% saturation and closes the Calibration Wizard.8. Follow the instructions for 100% oxygen calibration.9. After allowing 5 to 10 minutes for temperature stabilization, clickthe Run button. The display will continuously update as readingsare taken and compared against the stabilization criteria.10. When readings have stabilized, the screen will appear similar tothe one below, and you have several choices:• Select Next to display the Zero Oxygen Point screen. Continuewith step 11 to calibrate at 0%.• Select Next, then Next again to finalize the calibration if you areperforming a one-point calibration. Go to step 14.• Select Run to run the oxygen saturation point again if youbelieve the sensor values are incorrect. Go back to step 9.TIP: The warning box below will appear if the slope is out ofrange. Repeat the 100% saturation calibration point.Zero Oxygen Point11. Immerse the RDO sensor in an oxygen-depleted medium:• Sodium sulfite (Na 2SO 3) solution is generally reliable, ifsomewhat messy. Use a laboratory beaker or In-Situ’s specialzero-point cal cup. Be sure the small well in front of the sensingfoil is filled with solution.• Nitrogen bubbling requires considerable time for oxygen to becompletely purged from the water.• Submerge the sensor completely, and check to be sure thatthere are no air bubbles on the sensing foil.• Allow up to 15 minutes for temperature equilibration.<strong>TROLL</strong> <strong>9500</strong> Operator’s <strong>Manual</strong> 930095110 rev. 007 01/09
Section 13: Dissolved Oxygen—Optical12. When you are ready to take the calibration point, click or tap Runin the Zero Oxygen Point screen.TIP: A warning box will appear if the slope is out of range(normal range is 0.9 to 1.1 with an offset of ±0.1). Repeatthe zero point.Finalize the Calibration14. The final calibration screen for a 1-point calibration at saturationwas performed. To finalize the calibration, click Finish.The display will continuously update as readings are taken andcompared against the stabilization criteria. Controls and statusindicators are the same as for the 100% calibration point.13. When readings have stabilized, the screen will appear similar tothe one shown in step 10, and you have two choices:• Select Next to finalize the calibration. Continue with step 14.• Select Back to calibrate the Oxygen Saturation point (step 9).TIP: Sodium sulfite consumes oxygen aggressively. Ifperforming the oxygen saturation point next, be sure to rinsethe <strong>TROLL</strong> <strong>9500</strong> and RDO sensor thoroughly to avoidcross-contamination.• Select Run to run the oxygen saturation point again if youbelieve the sensor values are incorrect. Go back to step 12.Status indicators:NOT TESTED appears until you begin the calibration by selecting Run.UNSTABLE indicates the sensor response does not meet the criteriafor a valid calibration point.NOMINAL indicates the deviation meets early stabilization criteria.The Accept button becomes available when nominal stability isachieved. You may accept the early value, or wait for complete stability. Ifyou accept the early value, the status will be designated “USER SET” inthe calibration report. (For more on calibration reports and the differencebetween Nominal and Stable, see Section 10 of this manual.)STABLE is displayed when the readings have stabilized sufficientlyto take a valid calibration point.• Reading: The temperature sensor response is shown in degreesC, and RDO sensor response is shown in mg/L. Win-Situ automaticallydetects stability in both parameters.• Deviation: Change in response between the last 2 readings. Thisenables you to follow the progress of the stabilization, but deviationfrom the previous reading is not necessarily the best indicatorof stability as the software is looking at longer-term trends.• Current barometric pressure in your selected unit.<strong>TROLL</strong> <strong>9500</strong> Operator’s <strong>Manual</strong> 940095110 rev. 007 01/09
Section 13: Dissolved Oxygen—OpticalThe values will be written to the sensor and you will be asked ifyou want to see the calibration report.TIP: For more on Calibration Reports, see Section 10 of thismanual.The RDO sensor is now calibrated and ready to take readings. Toconfirm this, take a reading by selecting the RDO sensor in the Navigationtree and clicking the Read button.Clean-upTIP: If the units for the reading are not what you expect, it iseasy to change the units selection: In Win-Situ, selectPreferences on the Options menu. In Pocket-Situ, select theHome site, then tap Setup in the command bar.Rinse the sensor and front end of the instrument very thoroughly aftercalibrating in sodium sulfite solution to avoid cross-contamination. Forbest results, always use fresh calibration solutions.Units and Calculated MeasurementsFour units are available for dissolved oxygen:TIP: To change unit preferences: In Win-Situ, selectPreferences on the Options menu. In Pocket-Situ, select theHome site, then tap Setup in the command bar.• Oxygen concentration in milligrams of oxygen per liter of water(mg/L). Since a liter of pure water weighs 1000 grams, and a milligramis 1/1000 of a gram, this is equivalent to ppm (parts permillion).• Oxygen concentration in micrograms of oxygen per liter of water (µg/L).This is equivalent to parts per billion (ppb).• Oxygen concentration in microMolar (µmol/L) = mg/L x 31.25• Oxygen saturation in % —100% DO being the maximum amountof oxygen that can be dissolved in water at a given atmosphericpressure, water temperature, and salinity. The percent saturationoutput is automatically corrected using the <strong>TROLL</strong> <strong>9500</strong> instrument’stemperature, conductivity, and barometric pressure values(from a baro sensor on vented cable or from a user-entered input).If no conductivity sensor is present, salinity is assumed to be zero.Usage Recommendations and CautionsThe amount of oxygen that can be dissolved in water decreases athigher temperatures and with increasing altitude (i.e., as barometricpressure drops) and salinity. In other words, as water becomeswarmer and saltier, it can hold less dissolved oxygen.During tests that include the RDO channel, the <strong>TROLL</strong> <strong>9500</strong> instrumentautomatically measures barometric pressure and temperaturefor compensation of DO readings.The barometric pressure value at the time of calibration is storedin the sensor and will be used to correct DO readings for weatherinducedpressure fluctuations taken at the same relative barometricpressure as the calibration. However, the large changes in barometricpressure due to changes in elevation are best accommodated byperforming a recalibration. If you calibrate at sea level, for example,and deploy the instrument in the mountains, you should perform arecalibration at the new altitude.Exposure to direct sunlight can bleach the sensing foil over time butthis effect is minimized with the protection provided by the opaqueoptical isolation layer. However, the frequent application of strong bluelight (blue LED during readings) will eventually have a bleaching effecton the foil. In-Situ recommends sampling intervals of greater than 1minute for long-term deployments.SalinitySince the absolute solubility of oxygen is lower in saline waters, it isadvantageous to compensate DO concentration readings (μg/L, mg/L,μmol/L) to ensure that the sensor accurately reports the concentrationof dissolved oxygen in the presence of significant salinity. This can beaccomplished by storing a salinity value in the sensor before takingmeasurements. The compensation algorithm is applied internallybefore the concentration is reported. The degree of compensation isminimal at very low salinities, and but may affect readings by severalpercent at higher levels.To store a salinity value in the RDO sensor, connect in Win-Situ 4 orPocket-Situ 4, select RDO in the Navigation tree, click Edit and in thenext screen select “Edit RDO Salinity Value.”Sensor Care and HandlingBiofoulingOrganisms that produce or consume oxygen, if attached to the areaof the sensing foil, may artificially influence the sensor’s measurementof the oxygen in the surrounding water. In addition, the sensor’sresponse time may be increased.To avoid this the sensor should be cleaned at regular intervals dependingon the required accuracy and the fouling condition at the site.<strong>TROLL</strong> <strong>9500</strong> Operator’s <strong>Manual</strong> <strong>9500</strong>95110 rev. 007 01/09
Section 13: Dissolved Oxygen—OpticalMaintenance and StorageCleaning the Sensor Cap1. Leave the cap on the sensor!2. Rinse the sensor with clean water from a squirt bottle or spraybottle.3. Gently wipe with a soft cloth or brush if biofouling is present.4. If extensive fouling or mineral build-up is present, soak the capend in vinegar for 15 minutes, then soak in deionized water for 15minutes.Do not use organic solvents—they will damage the foil. Donot remove the cap from the sensor prior to brushing.After cleaning the sensor, perform a 2-point user calibration.Cleaning the Optical Window (Perform only if changing the cap)Remove the cap and gently wipe the window with the supplied lenswipe.Caution: Do not wet the lens area with water or any solution.Cleaning the Sensor BodyWith the sensor cap installed on sensor, gently scrub sensor body witha soft brush. Soak in vinegar and DI water to remove mineral depositsor extensive fouling as in step 4, above.StoragePrior to installation: Store in factory supplied container.Installed: The RDO sensor can be stored wet or dry. When installedwith other sensors, it may be useful to store all sensors in a moist environment.In-Situ supplies recyclable plastic calibration and storagesleeves, as well as calibration and storage vessels for this purpose.Replacing the Sensor CapThe sensor cap has a 1-year life after the <strong>TROLL</strong> <strong>9500</strong> instrumenttakes its first RDO sensor reading. Replacement caps are availablefrom In-Situ Inc. or your authorized In-Situ distributor.1. Pull the used sensor cap off of the sensor, without twisting.2. Remove the existing o-rings from the sensor.3. Use a lint-free cloth to remove any moisture from the sensor body.Note: Ensure that there is no moisture in the o-ring grooves.Avoid touching or cleaning the lens with anything other thanthe supplied lens wipe.RDO Sensor Summary• When a turbidity wiper is installed, be sure to pull the slack inthe RDO adapter cable back against the <strong>TROLL</strong> <strong>9500</strong> body soit will not interfere with the wiper’s rotation.• To calibrate the Basic sensors with RDO installed, fill the softplastic cal insert (it has an orange base) with calibration solution,slide it up around the sensors, including the RDO cable,and use the RDO restrictor as a support during calibration.• The RDO sensor will work properly only in port 1 or 3 of the<strong>TROLL</strong> <strong>9500</strong>. Remember that a combination pH/ORP sensorwill operate properly only in port 1, and a turbidity wiper accessoryonly in port 3.• Basic sensors that require hydration (pH and pH/ORP) maybe stored in the calibration and storage sleeve for short periodsof time. For long-term storage, remove the RDO sensor—it isnot necessary to remove it from the adapter—with restrictorand nose cone. Attach the standard <strong>TROLL</strong> <strong>9500</strong> Cal Cup witha moist sponge in the bottom.• The RDO sensor and all <strong>TROLL</strong> <strong>9500</strong> materials are suitable formonitoring in low flow, groundwater, and surface water sites.4. Use your finger to apply a layer of lubricant around the o-ringgrooves. Place the o-rings on the sensor. Apply another thin layerof lubricant to the o-rings and grooves.Note: Do not transfer grease to the lens or sensor pins.5. Clean the lens on the sensor with the wipe provided in the kit andallow to dry thoroughly. Inspect for scratches or dirt.6. Remove the new cap from its sealed packaging and attach it tothe sensor, being careful to press firmly, without twisting, untilit seals over the probe body. Make sure that the o-rings are notpinched or rolled between the cap and sensor.7. Perform a 2-point calibration. No conditioning is required prior touse.<strong>TROLL</strong> <strong>9500</strong> Operator’s <strong>Manual</strong> 960095110 rev. 007 01/09
Multi-ParameterWater Quality <strong>TROLL</strong> ®14 Oxidation-Reduction PotentialWhat is ORP?Oxidation Reduction Potential (ORP) is a measure of a water system’scapacity to either release or gain electrons in chemical reactions.The process of oxidation involves losing electrons while reductioninvolves gaining electrons. Oxidation and reduction (redox) reactionscontrol the behavior of many chemical constituents in drinking water,wastewater, and aquatic environments. The reactivity and solubilityof critical elements in living systems is strongly dependent on redoxconditions. ORP values are used much like pH values to determinewater quality. While pH values characterize the relative state of asystem for receiving or donating hydrogen ions (acting as a base oran acid), ORP values characterize the relative state of a system forgaining or losing electrons. ORP values are affected by all oxidizingand reducing agents, not just acids and bases.Why Measure ORP?The effect that potable water has on plumbing is directly related to itsORP value. Unfavorable values can cause excessive corrosion, leadingto expensive repairs. ORP is one parameter that can be monitoredduring the disinfecting process for drinking water, swimming poolwater, and spa water.The life expectancy of bacteria in water is related to ORP. In fact,studies have shown that the life span of bacteria in water is moredependent on the ORP value than on the chlorine concentration. Forswimming pools at a normal pH value between 7.2 and 7.6, the ORPvalue must be kept above 700 mV to kill unwanted organisms. Hypochloriteor other oxidizing agents must be added when the ORP fallsbelow 700 mV. In contrast, natural waters need a much lower ORPvalue in order to support life. Generally ORP values above 400 mVTypical ORP valuesFluidORP (mV)Salt water aquarium ~ 350Harmful to aquatic life > 400Properly chlorinatedswimming pool > 700are harmful to aquatic life. Ideally the ORP value in salt water aquariumsshould be kept between 350 and 390 mV. ORP levels below 300mV are to be avoided. An oxidizing environment is needed to convertany ammonia (NH 3) to nitrites (NO 2–) and nitrates (NO 3–). Ammonialevels as low as 0.002 mg/l can be harmful to some fish species.The determination of ORP is particularly worthwhile in water thatcontains a relatively high concentration of a redox-active species, e.g.,the salts of many metals (Fe 2+, Fe 3+) and strong oxidizing (chlorine)and reducing (sulfite ion) agents. Thus, ORP can sometimes beutilized to track the metallic pollution of ground- or surface water, orto determine the chlorine content of wastewater effluent. However,ORP is a nonspecific measurement—that is, the measured potentialis reflective of a combination of the effects of all the dissolved speciesin the medium. Because of this factor, the measurement of ORP inrelatively clean environmental water (ground, surface, estuarine, andmarine) has only limited utility unless a predominant redox-activespecies is known to be present. Care is required not to “over-interpret”ORP data unless specific information about the site is known.The pH/ORP SensorThe single-junction, three-electrode sensor uses a potentiometricmethod to measure pH and ORP in a test solution. The pH electrodeconsists of a pH-sensitive glass whose voltage is proportional to thehydrogen ion concentration. The ORP electrode serves as an electrondonor or acceptor depending upon the test solution. The ref er enceelectrode supplies a constant stable output for comparison. Electricalcontact is made with the test solution using a saturated potassiumchloride (KCl) solution. The electrode behavior is described by theNernst equation:E m= E o- (RT/nF) ln {[ox] / [red]}whereE mis the potential from the ORP electrode,E ois related to the potential of the reference electrode,R is the Gas Law constant,<strong>TROLL</strong> <strong>9500</strong> Operator’s <strong>Manual</strong>970095110 rev. 007 01/09
Section 14: orpF is Faraday’s constant,T is the temperature in Kelvin,n is the number of electrons,[ox] is the oxidant concentration in moles/L, and[red] is the reductant concentration in moles/L.Most natural waters contain many species that are involved in theredox process so that it is not possible to calculate the ORP usingthe Nernst equation. All redox species do however reach equilibrium.A Standard solution of known redox potential for a particularORP electrode is used to calibrate ORP. The sensor then gives acalibrated response in mV when placed in a sample.Sensor InstallationThe MP <strong>TROLL</strong> <strong>9500</strong> may be shipped with a pH/ORP sensorinstalled. If installation is necessary, unpack and install the sensor inport 1 of the MP <strong>TROLL</strong> <strong>9500</strong> as follows.The combination pH/ORP sensor will work properly onlyin port 1.TIP: To ensure optimum response for a new or previouslystored sensor, rinse off the soaking solution, then soak thesensor in clean water for at least 15 minutes before calibrating.1. Remove the restrictor or Cal Cup from the front end of the <strong>TROLL</strong><strong>9500</strong>. This allows access to the sensor block shown below.2. Remove the sensor hydration bottle and set aside for future use.3. Rinse the sensor in clean water to remove the soaking solution.Soak the sensor in clean water for at least 15 minutes beforecalibrating.4. Remove any moisture or dirt from the area aroundport 1, then use the sensor removal tool to removethe plug from the port. Retain the plug for future use.Install pH/ORPsensor inport 1 onlypH/ORP Sensor PositionPressure/Turbidity(or plug)Temperaturealignment marksensorremovaltool5. Remove any moisture or dirt from the port connector with a cleanswab or tissue.6. Remove the cap from the sensor connector. Check lubrication ofthe o-rings. If they appear dry, apply a silicone lubricant.7. Visually align the sensor connector pins with the port connectorpins.8. Press the sensor firmly into the port until you feel it dock with theport connector. When properly inserted a small gap (the width ofthe sensor removal tool) remains between the widest part of thesensor and the instrument body, for ease of removal.CalibrationOverviewA one-point calibration in a solution with a known potential at a giventemperature is sufficient to calibrate ORP. Software options:• Quick Cal: Calibrates ORP (and optionally pH, polarographic D.O.,and conductivity) at one time with one solution.• Traditional calibration: A one-point calibration in a solutionspecifically formulated for calibrating ORP. Results in calculation ofsensor offset.• Default coefficients: Resets the sensor’s factory defaults. Nosolutions are required.Nominal vs. StableTo shorten the calibration time, you have the option to accept thecalibration when “Nominal” stability conditions are achieved. If theearly value is accepted, the calibration point will be designated “USERSET” in the calibration report. If the calibration was performed throughto stability (“STABLE” in the calibration report), the sensor will operateas intended by In-Situ’s quality standards.Calibration SolutionsOnly one solution is required for ORP calibration. Quick Cal andZoBell’s solution are available from In-Situ Inc. A custom solution maybe used in a Traditional calibration if its milliVolt value at the calibrationtemperature is known.Please note that a pH/ORP sensor requires separate calibrationsfor pH and ORP. The Quick Cal procedure producesexcellent results for ORP so long as the solution is stored asrecommended and used before its expiration date. After performing aQuick Cal for ORP, we recommend a 2- or 3-point Traditionalcalibration for pH, as described in Section 11 of this manual.<strong>TROLL</strong> <strong>9500</strong> Operator’s <strong>Manual</strong> 980095110 rev. 007 01/09
Section 14: orpRecommended Calibration Order for pH and ORPThe pH/ORP sensor requires separate calibrations for pH and ORP. Asuggested calibration scenario is as follows:A. First, Quick-Cal ORP (plus, optionally, other installed Basic sensors).For the procedure, see Section 3, Getting Started.B. Then, perform a 2- or 3-point Traditional pH calibration as describedin Section 11 of this manual.Traditional ORP Calibration Procedure8. In the ORP Calibration Wizard, select the solution the sensor issoaking in. For ZoBell’s, the reference milliVolt value is availablein the software. For a custom solution, select “Other” and enter themV of the solution at the calibration temperature.8If you wish to perform a traditional calibration with a dedicated ORPcalibration solution, use the following procedure.1. With a pH/ORP sensor installed and plugs or sensors in the otherports, rinse the front end of the MP <strong>TROLL</strong> <strong>9500</strong> inclean water. For best results, rinse again in a portionof the calibration solution.2. Fill the Cal Cup with ZoBell’s or other custom ORPcalibration solution.3. Attach the Cal Cup to the MP <strong>TROLL</strong> <strong>9500</strong>. Threadthe Cal Cup onto the body until seated against theo-ring, then back off slightly to avoid overtightening.4. Connect the MP <strong>TROLL</strong> <strong>9500</strong> to a PC and establish aconnection in Win-Situ 4 or Pocket-Situ 4.39. Select Next to continue.10. In the next screen, select Run to begin the stabilization.The display will continuously update as readings are taken andcompared against the stabilization criteria.95. Select the MP <strong>TROLL</strong> <strong>9500</strong> in the Navigation tree.The software will automatically detect and display theinstalled sensors. (This can take a moment.)6. Select ORP in the Parameters list. The sensor serialnumber (SN) and recent calibration information is displayed.67. Select Calibrate to launch the ORP Calibration Wizard.7• Status:Indicators during CalibrationNOT TESTED is displayed until you begin the calibration by selectingRun.UNSTABLE indicates the sensor response does not meet the criteriafor a valid calibration point.NOMINAL indicates the sensor deviation meets early stabilizationcriteria.The Accept button becomes available when nominal stability isachieved. You may accept the early value, or wait for complete stability.If you accept the early value, the calibration point will be designated“USER SET” in the calibration report. (For more on calibration reports,see “Calibration History” in Section 10.)STABLE is displayed when the readings have stabilized sufficiently totake a valid calibration point. The calibration proceeds automatically tothe next screen.• Temperature is displayed for your information.• Sensor Reading: The current sensor response in milliVolts.• Sensor Deviation: Change in sensor response between the last tworeadings. This enables you to follow the progress of the stabilization,but deviation from the previous reading is not necessarily the bestindicator of stability as the software is looking at longer-term trends.<strong>TROLL</strong> <strong>9500</strong> Operator’s <strong>Manual</strong> 990095110 rev. 007 01/09
Section 14: orp11. The final screen shows the calculated sensor offset. This valueshould be 0 mV ± 20 mV.Sensor OffsetThe offset for ORP is a traditional “zero offset,” and is typically 0 ± 20mV. If the offset calculated during calibration is outside this range, inspectthe sensor. If it is clean, then the fault was probably with the calsolution (aging, exposure to air, etc.). In this case, resetting the factorydefaults for ORP can often restore the sensor performance.Units and Calculated MeasurementsORP readings may be displayed in Volts or milli Volts. No calculatedmeasurements are available.12. Select Finish to write this value to the sensor.The ORP sensor is now calibrated and ready to use.TIP: You can look at the calibration report right aftercalibrating, or at any time. See “Calibration History” inSection 10 for details.TIP: The calibration solution may be flushed down the drainwith running water, or saved in a separate container andused to rinse the next time you calibrate with the same solution.Options for storing sensors:• If the instrument will be used in a day or so, leave the sensorsinstalled. Remove the Cal Cup and rinse it and the sensors. Add50-100 mL of tap water to the Cal Cup. Return the probe to the CalCup for transport to the field site.• For longer storage, see the section on Sensor Care and Handlinglater in this chapter.Resetting Default CoefficientsThe sensor’s calibration may be reset back to factory defaults at anytime. This is a good option if the results of a recent calibration aresuspect because the cal solution has been exposed to air or hasotherwise deteriorated1. With a pH/ORP sensor installed, establish a connection to theinstrument in Win-Situ 4 or Pocket-Situ 4.2. Select ORP in the Parameters list and click Calibrate.3. In the first screen, select Use Default Coefficients, then Next.4. In the final screen, click Finish to send the values to the sensor.12Recommended Calibration FrequencyCalibration frequency will depend on the nature of the sample andthe degree of accuracy required. In clean water samples, the sensorcould retain its accuracy for 2-6 weeks. Recalibrate the sensor—• after replacing the reference junction and/or the filling solution,• during routine, scheduled maintenance,• every 2-6 weeks in the absence of other indications.Normalization to Standard HydrogenElectrode ValuesORP values are dependent on solution composition, temperature, andsensor type. ORP (Eh) values reported in the literature are often normalizedto the standard hydrogen electrode as a standard referenceelectrode. Since the standard hydrogen electrode is extremely fragile,it is impractical to use in the field. In-Situ’s sensor uses a silver/silver-chloridereference electrode in place of the standard hydrogen electrode.The following equation may be used to normalize the readings reportedby our sensor calibrated with our solution to standard hydrogenelectrode values (±50 mV).ORP SHE= ORP observed+ {215.81 – T C∗ [0.77942 + T C∗ 0.001934]}where ORP SHEis the sample potential relative to the standardhydrogen electrodeORP observedis the sample potential relative to the In-Situreference electrodeT Cis the sample temperature in °CORP measured by a sensor immersed in a solution should not beequated with thermodynamic Eh. Differences may occur due to lackof chemical equilibrium, presence of multiple redox couples, sensorpoisoning, and other factors.In addition, like all platinum ORP electrodes, In-Situ’s pH/ORP sensormay give unstable readings in solutions containing chromous, vanadous,titanous, and other ions that are stronger reducing agents thanhydrogen or platinum.<strong>TROLL</strong> <strong>9500</strong> Operator’s <strong>Manual</strong> 1000095110 rev. 007 01/09
Section 14: orpUsage Recommendations and Cautions• ORP readings vary slightly with temperature, but are not easily correctedbecause, unlike pH, the ORP value depends on the activityof many ions in solution. pH values are more easily correctedbecause they are due to the activity of one ion, H + .Sensor Care and HandlingSensor RemovalUse the sensor removal tool to pop the sensor out.Maintenance/Inspection/CleaningsensorremovaltoolIf the platinum ORP sensor appears dull or fouled, it may be cleanedwith a swab dipped in alcohol. Rub gently until the platinum appearsshiny. Rinse in clean water.If a film develops on the glass electrode, or if the sensing glass orjunction become dehydrated, the response may be sluggish or erratic,or the sensor may fail to calibrate. In these cases, rinse the sensorin 90% isopropyl alcohol, then soak in storage solution (Catalog No.0065370) for at least an hour, overnight if needed. If this does not restorethe response, try soaking in 0.1 M HCl solution for 5-10 minutes,followed by a thorough rinse in clean water. If the response has stillnot improved, replace the filling solution, or the junction.Note: The following maintenance instructions apply to In-Situ’s newestpH/ORP sensor (cat. no. 0059520). Older sensors (cat. no. 0032010& 0032020, now discontinued) are not user-serviceable.Replacing the Filling SolutionReplace the filling solution every 5-6 months, or when:• The sensor fails to calibrate with reasonable slope and offset• Readings drift• Readings during calibration at pH 7 are outside the range 0±20 mV1. Unscrew the reference junction as shown.2. Holding the sensor at an angle, shake out the old filling solution.3. Protect the connector end of the sensor with the soft cap it shippedwith, or wrap the sensor in a paper towel toprevent solution from entering the connector.5. Screw in the reference junction, and hand-tighten until snug. Somefilling solution will overflow. Wipe the excess off the sensor body.6. Soak the sensor in tap water for at least 15 minutes.7. Recalibrate the sensor.If necessary, thoroughly clean the electrical connector toremove filling solution: Using a disposable pipette, fill theconnector with isopropyl alcohol (70% to 100%). Shake todry. Repeat 3 times. Dry overnight. When thoroughly dry, recalibrate.Replacing the JunctionReplace the junction when the sensor fails to calibrate, even afterreplacing the filling solution.1. Unscrew the reference junction and discard.2. Replace the filling solution and screw in a new reference junctionas described above.3. Soak for 15 minutes in tap water, then recalibrate the sensor.StorageTIP: Keep the junction damp at all times to avoid a lengthyrewetting process.Short-Term Storage (several days)Store in the Cal Cup in tap water.Long-Term Storage (up to several weeks)Remove the sensor and store in the electrode storage bottle with10-20 mL of storage solution (Catalog No. 0065370). Tighten the capto prevent drying. Prior to use, condition the sensor by rinsing withdeionized or tap water and soaking for 15 minutes.ReferencesEaton, A.D., L.S. Clesceri, E.W. Rice, and A.E. Greenberg, eds.,Standard Methods for the Examination of Water and Wastewater,21st edition, Washington, D.C.: American Public Health Association,American Water Works Association, and Water EnvironmentFederation, 2005. Section 2580, Oxidation-Reduction Potential.4. Using the dispenser cap on the filling solution bottle,insert the tube into the bottom of the empty reservoir.Squeeze a steady stream of solution into the reservoir untilit overflows and no bubbles are observed.Continue to add solution while withdrawing the tube.<strong>TROLL</strong> <strong>9500</strong> Operator’s <strong>Manual</strong> 1010095110 rev. 007 01/09
Multi-ParameterWater Quality <strong>TROLL</strong> ®15 AmmoniumWhat is Ammonium ?Ammonium (NH 4 + ) is the ionized form of ammonia (NH 3). Ammoniaand ammonium are naturally occurring forms of nitrogen, part of thenitrogen cycle. In natural waters they exist in two forms: Dissolvedammonia gas (NH 3) is highly toxic to aquatic life, while ammonium,the ionized form (NH 4 + ), is not. Both may be grouped together as“total ammonia.”The ammonia/ammonium equilibrium in water is closely related to pHlevels. At a pH of 6.5 almost all ammonia is in the form of ammonium.However, as the pH increases (becomes more basic), ammonium ischanged into harmful ammonia. Ammonium ions are the predominantspecies in most unpolluted natural water systems where the pH istypically less than 9. Even a small amount of ammonia is detrimentalto fish while a moderate amount of ammonium is tolerated. The lethaldose of ammonia for trout is only 0.2 mg/L.Why Measure Ammonium?Major sources of ammonium are wastewater from sewage treatmentplants, and nitrogen in fertilizers which is transformed to ammonium insoil by microorganisms. Ammonia/ammonium can be a key parameterThe Nitrogen Cyclein the assessment of water and wastewater quality. Measurement ofammonium can yield information on the composition and movementof pollutants in groundwater and surface water, landfill leachate, runofffrom agricultural activities, waste concentrations in fisheries, and nutrientlevels in natural water bodies.The Ammonium SensorThe In-Situ sensor is an ion-selective electrode (ISE) that is selectivefor the ammonium ion (NH 4 + ). It is a double-junction combination ISEwith a silver/silver-chloride reference half-cell, PVC sensing membrane,and reference electrolyte gel. It measures the concentration inparts per million of ammonium ion in solution (calculated as nitrogen,ppm as N).Sensor PreparationTo ensure optimum membrane response, the ammonium sensorshould be thoroughly hydrated in an appropriate solution beforecalibration. A good way to do this is to allow the sensor to soak in thesolution you plan to use for the first calibration point (lowest concentration)for at least 15 minutes and up to several days before calibrationand use.• 1.4 ppm N for calibration in the lower range (concentrations lessthan 14 ppm N)• 140 ppm N for calibration in the upper range (concentrations of 14ppm N and up)The sensor kit includes an empty bottle for this purpose.<strong>TROLL</strong> <strong>9500</strong> Operator’s <strong>Manual</strong> 1040095110 rev. 007 01/09
Section 15: AmmoniumSensor InstallationUnpack the ammonium sensor, hydrate it as above, and install in port1, 2, or 3 in the sensor block at the front end of the MP <strong>TROLL</strong> <strong>9500</strong>as follows.TIP: Remember that a polarographic D.O. sensor (if present)will operate properly only in port 2 and a turbidity wiperaccessory only in port 3.1. Remove the restrictor from the front end of the MP <strong>TROLL</strong> <strong>9500</strong>.This allows access to the sensor block depicted in the drawingbelow.2. Remove the sensor’s protective cap or storage bottle and set asidefor future storage of the sensor. If the connector end is coveredwith a cap, remove it also.3. Remove any moisture or dirt from the area aroundthe port where you will install the sensor, then use thesensor removal tool to remove the plug from the portwhere you will install the sensor.4. Remove any moisture or dirt from the port connector with a cleanswab or tissue.5. Check lubrication of the sensor o-rings.TIP: The sensor o-rings require generous lubrication beforeinstallation. New sensors will be lubricated at the factory. Ifthe o-rings appear dry, apply apply a silicone lubricant beforeinstallation.6. Handling the sensor by the sides, not the tip, align the mark on theside of the sensor with the mark on the port.Avoid touching the membrane at the tip of the sensor.Contaminants on the membrane can change its propertiesand affect measurements.Pressure/Turbidity(or plug)sensorremovaltool7. Use the sensor insertion tool to firmly press thesensor into the port until you feel it dock with theconnector at the bottom. When properly inserted asmall gap (width of the sensor removal tool) remainsbetween the widest part of the sensor and the instrumentbody, for ease of removal.CalibrationOverviewThe software offers several options for ammonium calibration.• Three-point bithermal (“two-temperature”) calibration. The firsttwo calibration points are taken in solutions of different concentrationsat the same temperature. The third point uses one of thesesolutions at a temperature that is at least 10° higher or lowerdepending on anticipated field conditions. This type of calibrationallows determination of the sensor’s “isopotential point”—theion concentration at which changes in temperature do not causea change in sensor response (voltage). A three-point bithermalcalibration is recommended before the first use of the sensor, andregularly thereafter, to insure accurate readings at all potentialtemperatures.• Two-point isothermal (“same temperature”) calibration using solutionsof two different concentrations. A two-point isothermal calibrationcalculates the sensor’s slope and offset but cannot computethe isopotential point. For best results this type of calibration shouldbe carried out as close as possible to the temperature at which thesensor will be used. Or, It may be performed after a previous threepointbithermal calibration to recalculate the slope and offset of anaging sensor while retaining the previously calculated isopotentialpoint.• Single-point calibration. After the initial three-point bithermal calibrationhas established the sensor slope, offset, and isopotentialpoint, a single-point calibration may be used with good results toadjust the offset on a daily basis.Calibration SolutionssensorinsertiontoolAmmonium sensor may be installedin port 1, 2, or 3Temperaturealignment markAmmonium chloride (NH 4Cl) solutions certified to N.I.S.T. standardsare supplied in the In-Situ Ammonium Calibration Kits:14.0 ppm as N140 ppm as N1400 ppm as N<strong>TROLL</strong> <strong>9500</strong> Operator’s <strong>Manual</strong> 1050095110 rev. 007 01/09
Section 15: AmmoniumSpecialized calibration kits are available for calibrating the ammoniumsensor for low-range and high-range measurements:Low range: two quarts each 14 ppm and 140 ppmHigh range: two quarts each 140 ppm and 1400 ppmRecommended Calibration FrequencyIon-selective electrodes are inherently unstable and drift is quitenormal. To achieve the most accurate sensor response, we recommenda complete three-point bithermal calibration once a week, with asingle-point calibration daily or after 4-6 hours of use.Preparing to CalibrateYou will need:3. Insert the front end of the MP <strong>TROLL</strong> <strong>9500</strong>into the open end of the Cal Cup. Thread theCal Cup onto the body until seated against theo-ring, then back off slightly to avoid overtightening.To stabilize the instrument, you may wish touse a calibration stand or other support.4. Connect the MP <strong>TROLL</strong> <strong>9500</strong> to a PC andestablish a connection in Win-Situ 4 or Pocket-Situ 4. Win-Situ screens are illustrated here.The Pocket-Situ interface is similar, with theNavigation tree at the top of the screen andthe Information pane below it.Cal Cup• MP <strong>TROLL</strong> <strong>9500</strong> with the hydrated ammonium sensor installed andsensors or plugs in the other sensor ports• Cal Cup• One, two, or three ammonium calibration solutions, selected forthe range you expect to measure. When performing a multi-pointcalibration, begin with the lowest-concentration solution.• For a three-point bithermal calibration: a temperature bath, or containerof ice large enough to hold the Cal Cup (and stirrer, if used).• Stirrer: Use a stirrer during calibration if it will also be used in thefield—for example, in stagnant or very slowly moving water. Themore closely calibration conditions reflect field conditions, the moresuccessful the calibration. For more information on the stirrer, see“Stirring” in Section 10.Ammonium Calibration Procedure1. Rinse the Cal Cup and front end of the MP <strong>TROLL</strong> <strong>9500</strong> in cleanwater. Shake to dry.For best results, follow this with a rinse in a portion of the selectedcalibration solution. Discard the rinse solution.5. Select the MP <strong>TROLL</strong> <strong>9500</strong> in the Navigationtree.The software will automatically detect anddisplay the installed sensors. If one or moresensors is installed in the wrong port, an errormessage will be displayed. Simply removethe sensor and install it in the correct position,then “refresh” the device before continuing.6. Select Ammonium in the Parameters list. The sensor serial number(SN) and recent calibration information is displayed.63Stirrer(optional)2. Insure the black PVC base (or the stirrer) is attached to the CalCup, and fill the Cal Cup to the fill line with the selected calibrationsolution.• Begin with the lowest concentration when performing a multipointcalibration.• With a full complement of sensors installed, use the lower lineas a guide.• With 1 or 2 removable sensors installed, fill to the upper line.7. Select Calibrate.7<strong>TROLL</strong> <strong>9500</strong> Operator’s <strong>Manual</strong> 1060095110 rev. 007 01/09
Section 15: AmmoniumThe Ammonium Calibration Wizard starts. A screen like this isdisplayed.8The Accept button becomes available when nominal stability isachieved. You may accept the early value, or wait for completestability. If you accept the early value, the calibration point willbe designated “USER SET” in the calibration report. (For moreon calibration reports, see “Calibration History” in Section 10.)STABLE is displayed when the readings have stabilized sufficientlyto take a valid calibration point. The calibration proceedsautomatically to the next screen.• Sensor Reading: The current sensor response in milliVolts.• Deviation: Change in sensor response between the last two readings.8. Select the number of calibration points for this calibration, and theconcentration (ppm) of the calibration solution for each point.Cal point 1 is the solution the sensor is soaking in now, the lowestconcentration for a multi-point calibration. If doing a three-pointbithermal cal, choose cal point 3 to be the same as either cal point1 or cal point 2.9. Select Next to continue.10. In the next screen, select Run to begin the stabilization.9• Current temperature is also displayed.11. If doing a single-point calibration, go to step 16.For a multi-point calibration, the Wizard returns to the screenshown at step 10 and waits for you to situate the probe in the nextcalibration solution and click Run.12. Remove the Cal Cup, discard the first solution, rinse the Cal Cupand the front end of the instrument with clean water, followed bya rinse in the next calibration solution, refill the Cal Cup with thesecond solution, and attach it to the instrument.TIP: The used calibration solution may be flushed down thedrain with running water, or saved in a separate containerand used as a rinse the next time you calibrate with thesame solution.13. Select Run to begin the stabilization for cal point 2. Status indicatorsand controls are the same as for cal point 1 (step 10).The display will continuously update as readings are taken andcompared against the stabilization criteria.• Status indicators:10NOT TESTED is displayed until you begin the calibration byselecting Run.UNSTABLE indicates the sensor response does not meet thecriteria for a valid calibration point.NOMINAL indicates the sensor deviation meets early stabilizationcriteria.Again wait for Stable status (or click Accept when Nominal isindicated).If doing a two-point calibration, go to step 16.14. For the third calibration point, use the cal point 1 or cal point 2solution (as specified in step 8) but change the temperature by atleast 10°C. A convenient way to do this is to move the probe—CalCup and all—into a temperature-controlled bath or container ofice. Allow time for the sensor to reach thermal equilibration withthe solution temperature. With stirring or agitation, this should takeabout 10 minutes, perhaps up to 30 minutes if left undisturbed.15. When the temperature is stable, select Run for cal point 3.When Nominal is accepted or Stable is indicated for cal point 3,the final screen is displayed.<strong>TROLL</strong> <strong>9500</strong> Operator’s <strong>Manual</strong> 1070095110 rev. 007 01/09
Section 15: Ammonium16. The final screen of the Calibration Wizard shows the sensorslope and offset calculated during the calibration process. For athree-point bithermal calibration, the calculated isopotential pointis shown. If a single-point calibration has been performed, theisopotential point is the one calculated during the last three-pointbithermal calibration.17. Select Finish to program the sensor with the newly calculatedcalibration coefficients.Usage Recommendations and CautionsAmmonium SensorOperating TemperaturePressure RatingpH range up to 8.5-5°C to 40°C (23°F to104°F) continuoustemperature; can tolerate up to 50°C(122°F) intermittently20 psi (14 m, 46 ft)Do not submerge the ammonium sensor deeper than 46 ft(14 m). Do not use in the basic pH range (8.5 or higher).pHThe sensor’s pH range is that range over which a change in pH willnot cause a significant change in the measured voltage. It is theplateau on a graph of pH against mV at constant concentration of thedetected ion. Outside this range, a change in pH may cause a significantchange in the measured mV.TemperatureThe ammonium sensor is now calibrated and ready to use.TIP: You can look at the calibration report right aftercalibrating, or at any time. See “Calibration History” inSection 10 for details.Options for storing sensors:The ammonium sensor should calibrated immediately before use. Ifstorage is necessary, remove the sensor from the instrument and immersein 14 ppm N solution, for later use in the low ammonium range,or 140 ppm N solution, for use in the high range.Sensor Slope and OffsetThe expected slope for a new sensor is about 56 (± 2) mV per decadeof concentration (ppm). The calibration curve begins to deviate fromlinear at about 1 ppm. The sensor’s zero offset is recalculated witheach single-point calibration.Units and Calculated MeasurementsAmmonium ion concentration is reported in ppm (equivalent to mg/L).No calculated measurements are currently available.17The higher the temperature, the shorter the lifetime of the electrode.1°C difference in temperature causes a 2% error at 10 ppm, unless abithermal calibration is performed.ConductivityIn saline waters (conductivities of 1,000 µS/cm or higher), the presenceof interfering ions such as sodium or potassium may limit theusability of the ammonium sensor.Potential InterferencesThe following table lists concentrations of possible interfering ions thatcause 10% error at various levels of NH 4 + .Ion 100 ppm NH 4+10 ppm NH 4+1 ppm NH 4+Cs + 100 10 1K + 270 27 2.7Tl + 3100 310 31H + pH 1.6 pH 2.6 pH 3.6Ag + 270,000 27,000 2700Li + 35,000 3500 350Na + 11,100 1,100 110<strong>TROLL</strong> <strong>9500</strong> Operator’s <strong>Manual</strong> 1080095110 rev. 007 01/09
Section 15: AmmoniumSensor Care and HandlingSensor RemovalPosition the yoke of the sensor removal tool at the pointwhere the sensor meets the sensor block and pry thesensor upward.Avoid touching the membrane at the tip of thesensor. Contaminants on the membrane canchange its properties and affect measurements.Maintenance/Inspection/CleaningsensorremovaltoolAs long as extreme pH and high organic solvent content is avoided,the sensor should last for several months at room temperature.Eventually some of the components will leach out, and this will affectthe response (detection limit and scope), but this can be compensatedthrough calibration.If film buildup is visible on the membrane, rinse under a gentle streamof clean water, or swish gently in a mild detergent solution, rinse wellwith clean water, and shake to dry.To avoid depletion of the reference solution, do not allow the sensor tosoak in pure water for more than a few minutes at a time.ReferencesEaton, A.D., L.S. Clesceri, E.W. Rice, and A.E. Greenberg, eds.,Standard Methods for the Examination of Water and Wastewater,21st edition, Washington, D.C.: American Public Health Association,American Water Works Association, and Water EnvironmentFederation, 2005. Section 4500-NH 3 Nitrogen (Ammonia). D. Ammonia-SelectiveElectrode Method.EPA, Methods for Chemical Analysis of Water and Wastes,EPA/600/4-79-020, revised March 1983. Method 350.3, Nitrogen,Ammonia, Potentiometric, Ion Selective Electrode. Approved at 40CFR Part 136.Rundle, Chris C., A Beginners Guide to Ion-Selective ElectrodeMeasurements. Nico2000 Ltd., London, UK. On the web at www.nico2000.netU.S. Geological Survey, Office of Water Quality Technical Memorandum93.12: Water Resources Division Nomenclature Conventionsfor Reporting Concentrations of Ammonium Ions and Ammonia inNatural Waters. August 26, 1993.The electrode is not customer-refillable.StorageStore the sensor immersed in 14 or 140 ppm N solution, dependingon usage requirements, rather than dry or in DI water.<strong>TROLL</strong> <strong>9500</strong> Operator’s <strong>Manual</strong> 1090095110 rev. 007 01/09
Multi-ParameterWater Quality <strong>TROLL</strong> ®16 ChlorideWhat Is Chloride?Chloride (Cl – ) is a highly soluble ion in water and can potentially bepresent in high concentrations. Chloride enters the water supply whenrunoff from rain or irrigation dissolves a variety of chloride-containingsalts in rock and soil. Freshwater sources, streams, lakes, and undergroundaquifers typically have less than 10 ppm Cl – . Some waterswith as little as 250 ppm Cl – will taste salty to sensitive individuals,especially if the sodium cation (Na + ) is also present. Wastewater fromsewage or industrial facilities will normally contain higher amounts ofchloride. Chloride is naturally present in higher concentrations nearcoastal areas where it can infiltrate canals and sewers.Why Measure Chloride?Chloride ions are not toxic to humans. However, a high chloridecontent may harm some structures, especially those made of metal.Chloride can increase the rate of corrosion on metals in the presenceof water. Vegetation is also sensitive to the amount of chloride in thesoil. Agriculturally productive soils can be turned into unproductivewastelands over a period of time by irrigating with water containinghigh amounts of chloride. The WHO (World Health Organization) hasestablished 100 ppm Cl – as a maximum for water used for irrigation,while 250 ppm Cl – is the maximum for drinking water.and reference electrolyte gel. It measures the concentration in partsper million of chloride ion in solution (ppm Cl – ).Sensor PreparationTo insure the chloride sensor is thoroughly hydrated, soak it in distilledwater for about 15 minutes before installation. The sensor kit includesan empty bottle for this purpose. Unlike the ammonium and nitratesensors, the solid-state chloride sensor does not require soaking in asolution of specific concentration.Sensor InstallationUnpack the chloride sensor, hydrate it as described above, and installin port 1, 2, or 3 in the sensor block at the front end of the MP <strong>TROLL</strong><strong>9500</strong> as follows.TIP: Remember that a polarographic D.O. sensor (if present)will operate properly only in port 2, and a turbidity wiperaccessory only in port 3 .1. Remove the restrictor from the front end of the MP <strong>TROLL</strong> <strong>9500</strong>.This allows access to the sensor block depicted in the drawingbelow.The Chloride SensorThe In-Situ sensor is an ion-selective electrode (ISE) that is selectivefor the chloride ion (Cl – ). It is a double-junction combination ISE with asilver/silver-chloride reference half-cell, solid-state sensing electrode,Pressure/turbidity(or plug)Typical Chloride valuesFresh water < 10 ppm Cl –Sea water 20,000 ppm Cl –Irrigation water standard (WHO) 100 ppm Cl –Drinking water standard (WHO) 250 ppm Cl –Chloride sensor may be installedin port 1, 2, or 3Temperaturealignment mark<strong>TROLL</strong> <strong>9500</strong> Operator’s <strong>Manual</strong> 1100095110 rev. 007 01/09
Section 16: Chloride2. Remove the sensor’s protective cap or storage bottle and set asidefor future storage of the sensor.3. Remove any moisture or dirt from the area aroundthe port where you will install the sensor, then use thesensor removal tool to remove the plug from the portwhere you will install the sensor.4. Remove any moisture or dirt from the port connector with a cleanswab or tissue.5. Check lubrication of the sensor o-rings.TIP: The sensor o-rings require generous lubrication beforeinstallation. New sensors will be lubricated at the factory. Ifthe o-rings appear dry, apply apply a silicone lubricant beforeinstallation.6. Handling the sensor by the sides, not the tip, align the mark on theside of the sensor with the mark on the port.7. Use the sensor insertion tool to firmly press thesensor into the port until you feel it dock with theconnector at the bottom. When properly inserted asmall gap (width of the sensor removal tool) remainsbetween the widest part of the sensor and the instrumentbody, for ease of removal.CalibrationOverviewThe software offers several options for chloride calibration.sensorremovaltoolsensorinsertiontool• Three-point bithermal (“two-temperature”) calibration. The firsttwo calibration points are taken in solutions of different concentrationsat the same temperature. The third point uses one of thesesolutions at a temperature that is at least 10° higher or lowerdepending on anticipated field conditions. This type of calibrationallows determination of the sensor’s “isopotential point”—theion concentration at which changes in temperature do not causea change in sensor response (voltage). A three-point bithermalcalibration is recommended before the first use of the sensor, andregularly thereafter, to insure accurate readings at all potentialtemperatures.• Two-point isothermal (“same temperature”) calibration using solutionsof two different concentrations. A two-point isothermal calibrationcalculates the sensor’s slope and offset but cannot computethe isopotential point. For best results this type of calibration shouldbe carried out as close as possible to the temperature at which thesensor will be used. Or, it may be performed after a previous threepointbithermal calibration to recalculate the slope and offset of anaging sensor while retaining the previously calculated isopotentialpoint.• Single-point calibration. After the initial three-point bithermal calibrationhas established the sensor slope, offset, and isopotentialpoint, a single-point calibration may be used with good results toadjust the offset on a daily basis.Calibration SolutionsSodium chloride (NaCl) solutions certified to N.I.S.T. standards aresupplied in the In-Situ Chloride Calibration Kits:35.5 ppm Cl –355 ppm Cl –3545 ppm Cl –Specialized calibration kits are available for calibrating the chloridesensor for low-range and high-range measurements:Low range: two quarts each 35.5 ppm and 355 ppmHigh range: two quarts each 355 ppm and 3545 ppmRecommended Calibration FrequencyIon-selective electrodes are inherently unstable and drift is quitenormal. To achieve the most accurate sensor response, we recommenda complete three-point bithermal calibration once a week, with asingle-point calibration daily or after 4-6 hours of use.Preparing to CalibrateYou will need:• MP <strong>TROLL</strong> <strong>9500</strong> with the hydrated chloride sensor installed andsensors or plugs in the other sensor ports• Cal Cup• One, two, or three chloride calibration solutions, selected for therange you expect to measure. When performing a multi-pointcalibration, begin with the lowest-concentration solution.• For a three-point bithermal calibration: a temperature bath, or acontainer of ice large enough to hold the Cal Cup (and stirrer, ifused).• Stirrer: Use a stirrer during calibration if it will also be used in thefield—for example, in stagnant or very slowly moving water. Themore closely calibration conditions reflect field conditions, the moresuccessful the calibration. For more information on the stirrer, see“Stirring” in Section 10.<strong>TROLL</strong> <strong>9500</strong> Operator’s <strong>Manual</strong> 1110095110 rev. 007 01/09
Section 16: ChlorideChloride Calibration Procedure1. Rinse the Cal Cup and front end of the MP <strong>TROLL</strong> <strong>9500</strong> in cleanwater. Rinse very thoroughly if the chloride sensor has recentlybeen exposed to pH buffers during a pH calibration. Shake to dry.6. Select Chloride in the Parameters list. The sensor serial number(S/N) and recent calibration information is displayed.For best results, follow this with a rinse in a portion of the selectedcalibration solution. Discard the rinse solution.2. Insure the black PVC base (or the stirrer) is attached to the CalCup, and fill the Cal Cup to the fill line with the selected calibrationsolution.• Begin with the lowest concentration when performing a multipointcalibration.• With a full complement of sensors installed,use the lower line as a guide.• With 1 or 2 removable sensors installed, fillto the upper line.3. Insert the front end of the MP <strong>TROLL</strong> <strong>9500</strong>into the open end of the Cal Cup. Thread theCal Cup onto the body until seated against theo-ring, then back off slightly to avoid overtightening.To stabilize the instrument, you may wish touse a calibration stand or other support.4. Connect the MP <strong>TROLL</strong> <strong>9500</strong> to a PC andestablish a connection in Win-Situ 4 or Pocket-Situ 4. Win-Situ screens are illustrated here.The Pocket-Situ interface is similar, with theNavigation tree at the top of the screen andthe Information pane below it.5. Select the MP <strong>TROLL</strong> <strong>9500</strong> in the Navigationtree.Cal CupThe software will automatically detect and display the installed sensors.If one or more sensors is installed in the wrong port, an errormessage will be displayed. Simply remove the sensor and install itin the correct position, then “refresh” the device before continuing.3Stirrer(optional)67. Select Calibrate.The Chloride Calibration Wizard starts. A screen like this is displayed.8. Select the number of calibration points for this calibration, and theconcentration (ppm) of the calibration solution for each point.Cal point 1 is the solution the sensor is soaking in now, the lowestconcentration for a multi-point calibration. If doing a three-pointbithermal cal, choose cal point 3 to be the same as either cal point1 or cal point 2.9879. Select Next to continue.<strong>TROLL</strong> <strong>9500</strong> Operator’s <strong>Manual</strong> 1120095110 rev. 007 01/09
Section 16: Chloride10. In the next screen, select Run to begin the stabilization.12. Remove the Cal Cup, discard the first solution, rinse the Cal Cupand the front end of the instrument in clean water, followed by arinse in the next calibration solution, refill the Cal Cup with thesecond solution, and attach it to the instrument.TIP: The used calibration solution may be flushed down thedrain with running water, or saved in a separate containerand used as a rinse the next time you calibrate with thesame solution.1013. Select Run to begin the stabilization for cal point 2. Status indicatorsand controls are the same as for cal point 1 (step 10).Again wait for Stable status (or click Accept when Nominal isindicated).The display will continuously update as readings are taken andcompared against the stabilization criteria.• Status indicators:NOT TESTED is displayed until you begin the calibration byselecting Run.UNSTABLE indicates the sensor response does not meet thecriteria for a valid calibration point.NOMINAL indicates the sensor deviation meets early stabilizationcriteria.The Accept button becomes available when nominal stability isachieved. You may accept the early value, or wait for completestability. If you accept the early value, the calibration point willbe designated “USER SET” in the calibration report. (For moreon calibration reports, see “Calibration History” in Section 10.)STABLE is displayed when the readings have stabilized sufficientlyto take a valid calibration point. The calibration proceedsautomatically to the next screen.• Sensor Reading: The current sensor response in milliVolts.If doing a two-point calibration, go to step 16.14. For the third calibration point, use the cal point 1 or cal point 2solution (as specified in step 8) but change the temperature by atleast 10°C. A convenient way to do this is to move the probe—CalCup and all—into a temperature-controlled bath or container ofice. Allow time for the sensor to reach thermal equilibration withthe solution temperature. With stirring or agitation, this should takeabout 10 minutes, perhaps up to 30 minutes if left undisturbed.15. When the temperature is stable, select Run for cal point 3.When Nominal is accepted or Stable is indicated for cal point 3,the final screen is displayed.16. The final screen of the Calibration Wizard shows the calculatedsensor slope and offset. For a three-point bithermal calibration,the isopotential point is shown. If a single-point calibration hasbeen performed, the isopotential point is the one calculated duringthe last three-point bithermal calibration.• Deviation: Change in sensor response between the last two readings.• Current temperature is also displayed.11. If doing a a single-point calibration, go to step 16.For a multi-point calibration, the Wizard returns to the screenshown at step 10 and waits for you to situate the probe in the nextcalibration solution and click Run.1717. Select Finish to program the sensor with the newly calculatedcalibration coefficients.<strong>TROLL</strong> <strong>9500</strong> Operator’s <strong>Manual</strong> 1130095110 rev. 007 01/09
Section 16: ChlorideThe chloride sensor is now calibrated and ready to use.TIP: You can look at the calibration report right aftercalibrating, or at any time. See “Calibration History” inSection 10 for details.Options for storing sensors:The sensor should calibrated immediately before use. If storage isnecessary, remove the sensor from the instrument and immerse in 35ppm Cl solution, for later use in the low chloride range, or 355 ppm Clsolution, for use in the high range.Sensor Slope and OffsetThe expected slope for a new sensor is about 57 (± 2) mV per decadeof concentration (ppm). The calibration curve begins to deviate fromlinear at about 10 ppm. The sensor’s zero offset is recalculated witheach single-point calibration.Units and Calculated MeasurementsChloride ion concentration is reported in ppm (equivalent to mg/L). Nocalculated measurements are available.Usage Recommendations and CautionsChloride sensorOperating TemperaturePressure RatingpH range 2 to 12-5°C to 50°C (23°F to 122°F) continuoustemperature; can tolerate up to 60°C(140°F) intermittently100 psi (70 m, 231 ft)Do not submerge the chloride sensor deeper than 231 ft(70 m).Ion 100 ppm Cl – 10 ppm Cl – 1 ppm Cl –OH – 8000 800 80NH 312 1.2 0.12S 2O2–31 0.1 0.01Br – 0.3 0.03 0.003S 2– 10 -4 10 -5 10 -6I – 5x10 -5 5x10 -6 5x10 -7CN – 2x10 -5 2x10 -6 2x10 -7Complexes with BI 3+ , Cd 2+ , Mn 2+ , Pb 2+ , Sn 2+ , Tl 3+ and reducingagentsSensor Care and HandlingSensor RemovalTo remove the sensor, position the yoke of the sensorremoval tool at the point where the sensor meets thesensor block and pry the sensor upward.Maintenance/Inspection/CleaningsensorremovaltoolIf a film should form on the top of the membrane, use a swab toremove it, followed by a rinse in deionized water and soaking for a fewminutes in a solution of 35 ppm or 355 ppm Cl.To avoid depletion of the reference solution, do not allow the sensor tosoak in pure water for more than a few minutes at a time.The electrode is not customer-refillable.StorageStore the sensor immersed in 35 or 355 ppm Cl solution, dependingon usage requirements. For longer-term storage, it may be rinsed andstored dry to avoid depletion of the reference solution.pH EffectsThe sensor’s pH range is that range over which a change in pH willnot cause a significant change in the measured voltage. It is theplateau on a graph of pH against mV at constant concentration of thedetected ion. Outside this range, a change in pH may cause a significantchange in the measured mV.Potential InterferencesThe table on this page lists possible interfering ions that cause 10%error at various levels of Cl – .<strong>TROLL</strong> <strong>9500</strong> Operator’s <strong>Manual</strong> 1140095110 rev. 007 01/09
Multi-ParameterWater Quality <strong>TROLL</strong> ®17 NitrateWhat Is Nitrate ?Nitrogen is an essential nutrient for plants and animals. It exists in theenvironment in many different forms, constantly being replenishedas part of the nitrogen cycle. Nitrate (NO 3 – ) is one form of nitrogen inthe ecosystem that is very soluble in water. Nitrate enters the watersystem when runoff from rainfall or irrigation washes through soilsthat contain nitrate. The nitrate dissolves in the water and is carried tonearby streams and lakes. It also permeates downward into the soilwhere it may enter underground aquifers. The concentration of nitrogenin a body of water depends mostly upon the land cover and soiltype. Highest concentrations are associated with shallow groundwaterand agricultural use of the land. Agriculture is a large contributor tothe pollution of surface water and groundwater because of the useof fertilizers that contain nitrate. Also, densely populated livestockproduce large quantities of manure that can be changed into nitrateupon decay.Nitrate remains in surface water until it is consumed as a nutrient byplants or other organisms. Surface streams have nitrate concentrationsranging from 0.1 to 20 ppm N. Levels as high as 30 ppm N arefound in wastewater discharges and wastewater effluent plants whilelevels as low as 0.05 ppm N are found in unpolluted groundwater.Why Measure Nitrate?High nitrate levels in drinking water are associated with healthproblems. Nitrate is reduced to nitrite in the digestive system, whereit may then oxidize iron in the hemoglobin molecule of red blood cellsto form methemoglobin. Methemoglobin lacks the capacity to bind andcarry oxygen to tissues. As a result of this health risk, the EPA hasestablished 10 ppm N as the maximum limit of nitrate in drinking waterfor the USA.High levels of nitrate in lakes can lead to a process called eutrophication.Nitrates are nutrients for aquatic plants and algae, causingoverproduction when present in excessive levels. This acceleratedgrowth or bloom can eventually lead to a number of negative impactson the aquatic environment such as a reduction in dissolved oxygen,which can lead to the death of fish and other aquatic life. Reduction ofsunlight to submerged aquatic vegetation due to increased coverageon the surface causes a corresponding reduction in photosynthesisand eventual death.The Nitrate SensorThe In-Situ sensor is an ion-selective electrode (ISE) that is selectivefor the nitrate ion (NO 3 – ). It is a double-junction combination ISE witha silver/silver-chloride reference half-cell, PVC membrane, and referenceelectrolyte gel. It measures the concentration in parts per millionof nitrate ion in solution (calculated as nitrogen, ppm as N).The Nitrogen CycleTypical Nitrate valuesUnpolluted groundwaterSurface waterWaste waterDrinking water standard (EPA)0.05 ppm N0.1 to 20 ppm N~ 30 ppm N10 ppm N<strong>TROLL</strong> <strong>9500</strong> Operator’s <strong>Manual</strong> 1150095110 rev. 007 01/09
Section 17: NitrateSensor PreparationTo ensure optimum membrane response, the nitrate sensor shouldbe thoroughly hydrated in an appropriate solution before calibration. Agood way to do this is to allow the sensor to soak in the solution youplan to use for the first calibration point (lowest concentration) for atleast 15 minutes and up to several days before calibration and use.• 1.4 ppm N for calibration in the lower range (concentrations lessthan 14 ppm N)• 140 ppm N for calibration in the upper range (concentrations of 14ppm N and up)The sensor kit includes an empty bottle for this purpose.Sensor InstallationUnpack the nitrate sensor, hydrate it as above, and install in port 1,2, or 3 in the sensor block at the front end of the MP <strong>TROLL</strong> <strong>9500</strong> asfollows.TIP: Remember that a polarographic D.O. sensor (if present)will operate properly only in port 2 and a turbidity wiperaccessory only in port 3.1. Remove the restrictor from the front end of the MP <strong>TROLL</strong> <strong>9500</strong>.This allows access to the sensor block depicted in the drawingbelow.2. Remove the sensor’s protective cap or storage bottle and set asidefor future storage of the sensor. If the connector end is coveredwith a cap, remove it also.3. Remove any moisture or dirt from the area aroundthe port where you will install the sensor, then use thesensor removal tool to remove the plug from the portwhere you will install the sensor.sensorremovaltool4. Remove any moisture or dirt from the port connector with a cleanswab or tissue.5. Check lubrication of the sensor o-rings.TIP: The sensor o-rings require generous lubrication beforeinstallation. New sensors will be lubricated at the factory. Ifthe o-rings appear dry, apply apply a silicone lubricant beforeinstallation.6. Handling the sensor by the sides, not the tip, align the mark on theside of the sensor with the mark on the port.Avoid touching the membrane at the tip of the sensor.Contaminants on the membrane can change its propertiesand affect measurements.7. Use the sensor insertion tool to firmly press thesensor into the port until you feel it dock with theconnector at the bottom. When properly inserted asmall gap (width of the sensor removal tool) remainsbetween the widest part of the sensor and the instrumentbody, for ease of removal.CalibrationOverviewThe software offers several options for nitrate calibration.sensorinsertiontool• Three-point bithermal (“two-temperature”) calibration. The firsttwo calibration points are taken in solutions of different concentrationsat the same temperature. The third point uses one of thesesolutions at a temperature that is at least 10° higher or lowerdepending on anticipated fieldconditions. This type of calibration allowsdetermination of the sensor’s “isopotential point”—the ion concentrationat which changes in temperature do not cause a changein sensor response (voltage). A three-point bithermal calibrationis recommended before the first use of the sensor, and regularlythereafter, to insure accurate readings at all potential temperatures.Pressure/turbidity(or plug)Nitrate sensor may be installedin port 1, 2, or 3Temperaturealignment mark• Two-point isothermal (“same temperature”) calibration using solutionsof two different concentrations. A two-point isothermal calibrationcalculates the sensor’s slope and offset but cannot computethe isopotential point. For best results this type of calibration shouldbe carried out as close as possible to the temperature at which thesensor will be used. Or, It may be performed after a previous threepointbithermal calibration to recalculate the slope and offset of anaging sensor while retaining the previously calculated isopotentialpoint.<strong>TROLL</strong> <strong>9500</strong> Operator’s <strong>Manual</strong> 1160095110 rev. 007 01/09
Section 17: Nitrate• Single-point calibration. After the initial three-point bithermal calibrationhas established the sensor slope, offset, and isopotentialpoint, a single-point calibration may be used with good results toadjust the offset on a daily basis.Calibration SolutionsPotassium nitrate (KNO 3) solutions certified to N.I.S.T. standards aresupplied in the In-Situ Nitrate Calibration Kits:14.0 ppm as N140 ppm as N1400 ppm as NSpecialized calibration kits are available for calibrating the nitrate sensorfor low-range and high-range measurements:Low range: two quarts each 14.0 ppm and 140 ppmHigh range: two quarts each 140 ppm and 1400 ppmRecommended Calibration FrequencyIon-selective electrodes are inherently unstable and drift is quitenormal. To achieve the most accurate sensor response, we recommenda complete three-point bithermal calibration once a week, with asingle-point calibration daily or after 4-6 hours of use.Preparing to CalibrateYou will need:• MP <strong>TROLL</strong> <strong>9500</strong> with the hydrated nitrate sensor installed and sensorso0r plugs in the other sensor ports• Cal Cup• One, two, or three nitrate calibration solutions, selected for therange you expect to measure. When performing a multi-pointcalibration, begin with the lowest-concentration solution• For a three-point bithermal calibration: a temperature bath, or acontainer of ice large enough to hold the Cal Cup (and stirrer, ifused).• Stirrer: Use a stirrer during calibration if it will also be used in thefield—for example, in stagnant or very slowly moving water. Themore closely calibration conditions reflect field conditions, the moresuccessful the calibration. For more information on the stirrer, see“Stirring” in Section 10.Nitrate Calibration Procedure1. Rinse the Cal Cup and front end of the MP<strong>TROLL</strong> <strong>9500</strong> in clean water. Shake to dry.For best results, follow this with a rinse in aportion of the selected calibration solution.Discard the rinse solution.2. Insure the black PVC base (or the stirrer) isattached to the Cal Cup, and fill the Cal Cupto the fill line with the selected calibration solution.• Begin with the lowest concentration whenperforming a multi-point calibration.• With a full complement of sensors installed,use the lower line as a guide.• With 1 or 2 removable sensors installed, fillto the upper line.3. Insert the front end of the MP <strong>TROLL</strong> <strong>9500</strong>into the open end of the Cal Cup. Thread theCal Cup onto the body until seated against theo-ring, then back off slightly to avoid overtightening.To stabilize the instrument, you may wish to use a calibration standor other support.4. Connect the MP <strong>TROLL</strong> <strong>9500</strong> to a PC and establish a connectionin Win-Situ 4 or Pocket-Situ 4. Win-Situ screens are illustratedhere. The Pocket-Situ interface is similar, with the Navigation treeat the top of the screen and the Information pane below it.5. Select the MP <strong>TROLL</strong> <strong>9500</strong> in the Navigation tree.Cal CupThe software will automatically detect and display the installed sensors.If one or more sensors is installed in the wrong port, an errormessage will be displayed. Simply remove the sensor and install itin the correct position, then “refresh” the device before continuing.3Stirrer(optional)<strong>TROLL</strong> <strong>9500</strong> Operator’s <strong>Manual</strong> 1170095110 rev. 007 01/09
Section 17: Nitrate6. Select Nitrate in the Parameters list. The sensor serial number(SN) and recent calibration information is displayed.10. In the next screen, select Run to begin the stabilization.6107. Select Calibrate.The Nitrate Calibration Wizard starts. A screen like this is displayed.8. Select the number of calibration points for this calibration, and theconcentration (ppm) of the calibration solution for each point.Cal point 1 is the solution the sensor is soaking in now, the lowestconcentration for a multi-point calibration. If doing a three-pointbithermal cal, choose cal point 3 to be the same as either cal point1 or cal point 2.9. Select Next to continue.987The display will continuously update as readings are taken andcompared against the stabilization criteria.• Status indicators:NOT TESTED is displayed until you begin the calibration byselecting Run.UNSTABLE indicates the sensor response does not meet thecriteria for a valid calibration point.NOMINAL indicates the sensor deviation meets early stabilizationcriteria.The Accept button becomes available when nominal stability isachieved. You may accept the early value, or wait for completestability. If you accept the early value, the calibration point willbe designated “USER SET” in the calibration report. (For moreon calibration reports, see “Calibration History” in Section 10.)STABLE is displayed when the readings have stabilized sufficientlyto take a valid calibration point. The calibration proceedsautomatically to the next screen.• Sensor Reading: The current sensor response in milliVolts.• Deviation: Change in sensor response between the last two readings.• Current temperature is also displayed11. If doing a single-point calibration, go to step 16.For a multi-point calibration, the Wizard returns to the screenshown at step 10 and waits for you to situate the probe in the nextcalibration solution and click Run.<strong>TROLL</strong> <strong>9500</strong> Operator’s <strong>Manual</strong> 1180095110 rev. 007 01/09
Section 17: Nitrate12. Remove the Cal Cup, discard the first solution, rinse the Cal Cupand the front end of the instrument with clean water, followed bya rinse in the next calibration solution, refill the Cal Cup with thesecond solution, and attach it to the instrument.TIP: The used calibration solution may be flushed down thedrain with running water, or saved in a separate containerand used as a rinse the next time you calibrate with thesame solution.13. Select Run to begin the stabilization for cal point 2. Status indicatorsand controls are the same as for cal point 1 (step 10).Again wait for Stable status (or click Accept when Nominal isindicated).If doing a two-point calibration, go to step 16.14. For the third calibration point, use the cal point 1 or cal point 2solution (as specified in step 8) but change the temperature by atleast 10°C. A convenient way to do this is to move the probe—CalCup and all—into a temperature-controlled bath or container ofice. Allow time for the sensor to reach thermal equilibration withthe solution temperature. With stirring or agitation, this should takeabout 10 minutes, perhaps up to 30 minutes if left undisturbed.15. When the temperature is stable, select Run for cal point 3.When Nominal is accepted or Stable is indicated for cal point 3,the final screen is displayed.16. The final screen of the Calibration Wizard shows the sensorslope and offset calculated during the calibration process. For athree-point bithermal calibration, the calculated isopotential pointis shown. If a single-point calibration has been performed, theisopotential point is the one calculated during the last three-pointbithermal calibration.17. Select Finish to program the sensor with the newly calculatedcalibration coefficients.The nitrate sensor is now calibrated and ready to use.TIP: You can look at the calibration report right aftercalibrating, or at any time. See “Calibration History” inSection 10 for details.Options for storing sensors:The sensor should calibrated immediately before use. If storage isnecessary, remove the sensor from the instrument and immerse in 14ppm N solution, for later use in the low nitrate range, or 140 ppm Nsolution, for use in the high range.Sensor Slope and OffsetThe expected slope for a new sensor is about 57 (± 2) mV per decadeof concentration (ppm). The calibration curve begins to deviate fromlinear at about 10 ppm. The sensor’s zero offset is recalculated witheach single-point calibration.Units and Calculated MeasurementsNitrate ion concentration is reported in ppm (equivalent to mg/L). Nocalculated measurements are available.Usage Recommendations and CautionsNitrate SensorOperating TemperaturePressure RatingpH range 2.5 to 11-5°C to 40°C (23°F to104°F) continuoustemperature; can tolerate up to 50°C(122°F) intermittently20 psi (14 m, 46 ft)Do not submerge the nitrate sensor deeper than 46 ft(14 m).TemperatureThe higher the temperature, the shorter the lifetime of the electrode.1°C difference in temperature causes a 2% error at 10 ppm, unless abithermal calibration is performed.17<strong>TROLL</strong> <strong>9500</strong> Operator’s <strong>Manual</strong> 1190095110 rev. 007 01/09
Section 17: NitratePotential InterferencesThe following table shows concentrations of possible interfering ionsthat cause 10% error at various levels of NO 3 – .Ion 100 ppm NO 3–10 ppm NO 3–1 ppm NO 3–ClO–40.01 0.001 0.0001I – 0.5 0.05 0.005ClO–35 0.5 0.05CN – 10 1 0.1Br – 70 7 0.7NO–270 7 0.7HS – 100 10 1HCO–31000 100 10CO2–32000 200 20Cl – 3000 300 30H 2PO–45000 500 50HPO 42–5000 500 50PO3–45000 500 50AcO – 20,000 2000 200F – 60,000 6000 600SO2–4100,000 10,000 1000Sensor Care and HandlingSensor RemovalPosition the yoke of the sensor removal tool at the pointwhere the sensor meets the sensor block and pry thesensor upward.Avoid touching the membrane at the tip of thesensor. Contaminants on the membrane canchange its properties and affect measurements.sensorremovaltoolIf film buildup is visible on the membrane, rinse under a gentle streamof clean water, or swish gently in a mild detergent solution, rinse wellwith clean water, and shake to dry.To avoid depletion of the reference solution, do not allow the sensor tosoak in pure water for more than a few minutes at a time.The electrode is not customer-refillable.StorageStore the sensor immersed in 14 or 140 ppm N solution, dependingon usage requirements, rather than dry or in DI water.ReferencesEaton, A.D., L.S. Clesceri, E.W. Rice, and A.E. Greenberg, eds.,Standard Methods for the Examination of Water and Wastewater,21st edition, Washington, D.C.: American Public Health Association,American Water Works Association, and Water EnvironmentFederation, 2005. Section 4500-NO 3–D. Nitrate Electrode Method.EPA, Methods for Chemical Analysis of Water and Wastes,EPA/600/4-79-020, revised March 1983. Method 350.3, Nitrogen,Ammonia, Potentiometric, Ion Selective Electrode. Approved at 40CFR Part 136.Rundle, Chris C., A Beginners Guide to Ion-Selective ElectrodeMeasurements. Nico2000 Ltd., London, UK. On the web at www.nico2000.netMaintenance/Inspection/CleaningAs long as extreme pH and high organic solvent content is avoided,the sensor should last for several months at room temperature.Eventually some of the components will leach out, and this will affectthe response (detection limit and scope), but this can be compensatedthrough calibration.<strong>TROLL</strong> <strong>9500</strong> Operator’s <strong>Manual</strong> 1200095110 rev. 007 01/09
Multi-ParameterWater Quality <strong>TROLL</strong> ®18 TurbidityWhat Is Turbidity?Turbidity is an indirect measure of the clarity or transparency of water,and thus an important indicator of its condition and productivity.Created by suspended matter and microscopic organisms, turbiditycauses light to be scattered and absorbed rather than transmitteddirectly through water. Turbidity is the physical characteristic of thesolution that causes light scattering. Turbidity is the opposite of clarity.Typical turbidity valuesEPA drinking waterTreated waterFresh water, >21.5” visibilityFresh water, 2.5” visibilityShort-term stress to aquatic lifeUnsafe level for most aquatic life0.3 - 0.5 NTU0 - 1 NTU< 10 NTU240 NTU> 10 NTU> 100 NTUThe APHA reference work Standard Methods (Eaton and others,2005) defines turbidity as “an expression of the optical property thatcauses light to be scattered and absorbed rather than transmitted withno change in direction or flux level through the sample.”Turbidity is not . . .• a direct measure of clarity.• a measure of color.• a measure of suspended solids; it is a measure of theirlight-scattering abilities.The In-Situ Turbidity sensor* is in conformance with the ISO 7027turbidity standard which specifies 90° scattered light.Why Measure Turbidity?Turbidity measurements• can provide a reasonable estimate of the total suspended solids orsediments (TSS) concentration in water.• can tell us something about the healthof a natural water body. Clear waterlets light penetrate more deeply into alake or stream than does murky water.This light allows photosynthesis to occurand oxygen to be produced.* Contains an assembly, US Pat. No. 6,842,243Optional wiper• can be a useful indicator of runoff into surface water systems.• in flow-cell or in-line applications, when pumping water at very lowrates, can provide a good indication of true formation water.Higher turbidity levels make it more costly to treat surface water foruse as drinking water. Controlling turbidity may be an effective way toprotect against pathogens in drinking water.Aesthetic considerations also play a role in our desire to quantify turbidity:Most people would rather look at, drink, or swim in clear waterthan in water that appears cloudy, and closely associate appearancewith the health of the body of water.How Is Turbidity Measured?Historical methods for measuring turbidity relied on subjective estimatesthat depended largely on the eye of the beholder.In the Jackson Candle method, for example, a candle flame is observedthrough the length of a glass tube into whichTurbidity sensor a fluid sample is poured until the rays of transmittedand scattered light appear equal and the flameessentially disappears. Among several drawbacks tothis method, the reproducibility of standards formulatedfrom natural sediments was difficult to control.The Secchi disk method used in limnological studiesinvolves submerging a weighted, black-and-whitepainted metal plate until the pattern can no longer<strong>TROLL</strong> <strong>9500</strong> Operator’s <strong>Manual</strong> 1210095110 rev. 007 01/09
Section 18: Turbiditybe detected. The plate is then pulled up until it is visible again. Theaverage of the two depths provides an estimate of water clarity ortransparency.Modern turbidimeters measure the loss in intensity of a light beamas it passes through a solution containing suspended and dissolvedparticles that are large enough to scatter the light. The method isbased upon a comparison of the intensity of light scattered by thesample with the intensity of light scattered by a standard referencesuspension. The nephelometer is a particular type of turbidimeterthat measures the intensity of light scattered at right angles (90°) tothe incident light. This lessens the difficulty of differentiating smallchanges against a large background. Standards for turbidity-measurementinstruments specify the light source, angle, wavelength, beamwidth, and sample suspensions, among other factors. Many of today’scommonly accepted procedures (e.g., Standard Methods, EPA, andISO) apply to laboratory bench-top instruments.The Turbidity SensorThe optional turbidity sensor of the Multi-Parameter <strong>TROLL</strong> <strong>9500</strong> ispermanently-installed and factory-calibrated. It may be a turbiditysensor alone or a pressure/turbidity sensor combination. If your MP<strong>TROLL</strong> <strong>9500</strong> was ordered without a turbidity sensor or a pressuresensor, there will be a permanently installed plug in the pressure/turbiditysensor slot. A turbidity sensor or combination pressure/turbiditysensor can be added at the factory.The In-Situ turbidity sensor is comprised of a matched solid-statedetector-emitter pair positioned at right angles. The light source is aninfrared LED, optimized for operation at 870 nanometers (nm). Theoptical windows of the detector (photodiode) and emitter (LED) arescratch-resistant sapphire. ISO 7027 has set a detection angle of 90°and the light wavelength at 860 nm. The sensor uses active modulationfor ambient light rejection.The In-Situ sensor is an electronic nephelometer which comparesthe intensity of light scattered by the environmental fluid with intensityof light scattered by a standard reference suspension. The higherthe intensity of scattered light, as measured in NTU’s, the higher theturbidity. This measurement generally provides a very good correlationwith the concentration of particles in the water that affect clarity.However, measurements of scattered light cannot be directly relatedto a gravimetric equivalent, such as suspended sediment load, unlessa working curve for the specific sample is created.The Turbidity WiperThe optional wiper accessory helps to keep the turbidity sensor opticsfree of bubbles and fouling.The wiper installs in port 3 of the MP <strong>TROLL</strong> <strong>9500</strong> like other removeablesensors. A positional brace aligns it with respect to the turbiditysensor and keeps it stable in moving waters.The wiper pad is adhesive-free, low-abrasion cotton material. Thepad is easily replaced when it becomes too soiled to clean the sensoroptics effectively.Use of the wiper will significantly impact battery life. Lithiumbatteries are recommended.<strong>TROLL</strong> <strong>9500</strong> Operator’s <strong>Manual</strong> 1220095110 rev. 007 01/09
Section 18: TurbidityWiper InstallationThe MP <strong>TROLL</strong> <strong>9500</strong> may be shipped with the optional wiper alreadyinstalled in port 3, as shown on the drawing below. If installation isnecessary, unpack and install the wiper in port 3 as follows.The turbidity wiper will function properly only wheninstalled in port 3.1. Remove the restrictor from the front end of the MP <strong>TROLL</strong> <strong>9500</strong>.This allows access to the sensor block depicted in the drawingbelow.2. Use the sensor removal tool to remove the sensor orplug from port 3. Retain the plug for future use. Forbest access to port 3, you may need to remove sensorsor plugs from other ports as well.3. Check lubrication of the o-rings on the connector endof the wiper.sensorremovaltoolTIP: The wiper o-rings require generous lubrication beforeinstallation. New wipers will be lubricated at the factory. If theo-rings appear dry, apply apply a silicone lubricant before installation.4. Visually align the connector on the wiper with the connector at thebottom of port 3.5. Press firmly until you feel the wiper dock with the port connector.When properly inserted a small gap (width of the sensor removaltool) remains between the wiper body and the instrument body.6. Press the wiper into the bracket attached to the turbidity sensor.7. After installing a new wiper, we recommend you access wiper controlin the software while you can clearly see the wiper movement.Connect in software, select the wiper, and click Wipe to ensure thewiper passes over the turbidity sensor optics properly.Q:A:Wiper MovementWhat does the wiper do, and when is wiping necessary?The wiper helps keep the optical windows of the turbiditysensor clear of bubbles and debris during measurements.When the sensor is off, the wiper is parked in its “home”position over sensor port 4. When a turbidity measurement iscalled for—a manual reading, a scheduled reading during atest, while calibrating or profiling—the wiper makes a full 360degree sweep to clean the optics.Wiping is not needed when the instrument is hand-held forshort periods (Profiling). Gently swishing the MP <strong>TROLL</strong> inthe water should serve to dispel air bubbles.When the turbidity sensor is off—not taking a measurement—thewiper head is “parked” over port 4. When a turbidity measurementis requested, the wiper head passes over the optics, sweeping themclean, and returns to its parking place. One “wipe” consists of a 360°counter-clockwise sweep (viewed from the sensor end), as shown inthe drawing below. Wiping occurs automatically before turbidity readings—manualreads, profiling, calibration, and tests—that are morethan 15 seconds apart. If readings are less than 15 seconds apart, thewiper will wipe once, before the first reading.A single wipe may be initiated in the software when the instrumentis idle to clear the turbidity optics of bubbles or debris. The wiper’smovements are entirely software-controlled.TIP: 15 seconds are alotted for a wipe cycle. This time isgenerous to allow for slower wiper movement at very lowtemperatures.If readings—test, calibration, profiling—are more than 15 secondsapart, the turbidity sensor will be wiped automatically before eachreading. If readings are less than 15 seconds apart, the wiper willwipe the windows just once, before the first reading.Turbidity SensorDetector EmitterWiperbrack-2 3 4Install wiperin port 31Temperature<strong>TROLL</strong> <strong>9500</strong> Operator’s <strong>Manual</strong> 1230095110 rev. 007 01/09
Section 18: Turbidity<strong>Manual</strong> WipeTo wipe the turbidity sensor optics manually:1. With the wiper installed in port 3, connect the MP <strong>TROLL</strong> <strong>9500</strong> to aPC and establish a connection in Win-Situ 4 or Pocket-Situ 4.2. Select the Wiper in the Navigation tree.23. Click Wipe. The wiper will pass once over the turbidity sensoroptics and return to its home position.Wiper Guidelines and Precautions• If a wiper is installed during a Quick Cal of the Basic sensors (seeSection 3, Getting Started), steps should be taken to insure thewiper pad material does not absorb the Quick Cal solution. Thereare two ways to do this.– Remove the wiper head before doing the Quick Cal. Refer toWiper Maintenance guidelines later in this section for instructionson removing the wiper head.– Alternatively, soak the front end of the instrument in plain waterbefore calibrating to allow the wiping pad to absorb sufficientwater to prevent its absorbing any Quick Cal solution.• Do not attempt to move the wiper head by hand. Wiper movementis software-controlled.• The wiper pressure may be adjusted if necessary so that the padis effectively cleaning the sapphire windows of the turbidity sensorduring movement. Refer to Wiper Maintenance guidelines later inthis section.• The wiper pad or head may be replaced as needed. Refer to WiperMaintenance guidelines later in this section.• When an RDO optical dissolved oxygen sensor is installed, checkto see that the RDO adapter cable is out of the way of wiper movement.3CalibrationFactory CalibrationThe turbidity sensor has been factory-calibrated to achieve a sensoraccuracy of ± 5% or 2 NTU (whichever is greater). The sensor iscalibrated over its full range, 0 to 2000 NTU, using polymer standards.The resulting calibration coefficients are written to the sensor memory,where they are stored permanently. They may be overlaid by performinga field calibration as described below, or may be recalled from thesensor memory at any time.The MP <strong>TROLL</strong> <strong>9500</strong>’s turbidity sensor is ready to measure turbiditywithout any user intervention. It is advisable to take a turbidity readingfirst in your own calibration solution(s) as a check to ensure the accuracyis within your operational standards and requirements. If thisresult is satisfactory, a field calibration is not required.Field CalibrationField calibration (or “user calibration”) is an overlay function that isapplied after the factory calibration math is done. The factory calibrationapplies across the entire range of NTU, and can be altered in thefield with a 1 to 4 point calibration procedure as described below tocompensate for effects of sensor fouling and other factors. You maywish to perform a field calibration with standards other than polymer(i.e., Formazin).For best results, calibrate as close to field temperature as possible.Calibration SolutionsA nephelometer such as the In-Situ turbidity sensor should becalibrated using standard reference suspensions having reproduciblelight-scattering properties. The sensor has been factory-calibratedwith polymer suspensions, and the resulting calibration coefficientstake into account the light-scattering properties of the suspensionsand the sensor optics.Q:A:Why do I need to calibrate the turbidity sensor if ithas been calibrated in the factory?A new turbidity sensor is ready to measure turbidity withreference to suspended polymer standards. If you preferto reference turbidity measurements to Formazin ratherthan polymer, a field calibration with Formazin should beperformed.After cleaning the sensor, readings should be checkedwith standards and a field calibration performed ifnecessary.<strong>TROLL</strong> <strong>9500</strong> Operator’s <strong>Manual</strong> 1240095110 rev. 007 01/09
Section 18: TurbidityPolymer-based standards are submicron, non-surface charged, solidspheres in matrixes of ultrapure water in homogeneous suspension;this homogeneity allows linear dilutions. EPA approved the polymersuspensions in 1984 as a calibration standard for turbidimeters.Polymer suspensions are very stable, can withstand temperatureextremes, and have excellent lot-to-lot precision. A range of polymersuspensions are available individually from In-Situ Inc. for calibratingany expected turbidity range. They can be diluted with turbidity-freewater to achieve other NTU values (but see the cautions below).Avoid vigorous mixing or agitation, which will create air bubbles andlower the accuracy of the standards. It is advantageous to calibrate anephelometric turbidimeter with a standard that most closely matchesthe size of the particulates you will be measuring.Calibrating with Other SolutionsFormazin: If you wish to recalibrate with Formazin, keep these pointsin mind.• Requires very careful handling.• Must be shaken gently and allowed to settle for at least 5 minutesbefore use.• Should not be diluted.Diluting Polymer Suspensions: If you dilute polymer suspensions,keep these points in mind:• Do not dilute more than 10:1. Use good laboratory techniques.• Store carefully. PVC bottles are recommended.• Diluting polymer suspensions takes them out of the category of“primary standards”, they become “secondary standards.”• If not handled carefully, the dilutions can become unstable; thesuspension of particles may be lost.Recommended Calibration FrequencyYour own experience is the best guide to how often the turbidity sensorwill benefit from recalibration. The need for recalibration dependson the condition of the optical windows, which in turn depends onthe environment. In a biologically active environment, cleaning andcalibration will be required more often. Periodic checks in calibrationsolutions of known turbidity can be beneficial in indicating how wellthe sensor is holding its calibration.A field calibration is recommended• if you wish to reference turbidity measurements to a standard otherthan polymer.• after cleaning the sensor windows of contamination.• when readings appear to drift, or show unexpectedly high or lowresults.* if algal or other growth on the front end of the MP <strong>TROLL</strong> <strong>9500</strong>changes the reflective properties of the device.Turbidity Calibration ProcedureYou will need:• MP <strong>TROLL</strong> <strong>9500</strong> with turbidity sensor (wiper optional), plugs in anyunused sensor ports.• The restrictor, nose cone, and removable sensors (if any) that willbe installed when turbidity is measured.• A laboratory beaker large enough to hold the instrument and calibrationsolution.• One or more calibration standards for the region in which you wishto calibrate. Several ranges from Very Low to Full are suggested inthe Calibration Wizard.TIP: A 1-point to 4-point field calibration may be carried outin any range. When performing a multi-point calibration,begin with 0 NTU solution. For best measurement precisionthe highest NTU value should exceed the readings you expect in thefield.1. Rinse the front end of the MP <strong>TROLL</strong> <strong>9500</strong> with clean water. Shakewell to remove the rinse water; dry external surfaces (not the opticalwindows) with a clean tissue.2. Pour the selected calibration standard into the beaker and insertthe MP <strong>TROLL</strong> <strong>9500</strong> into the solution.The windows of the turbidity sensor should be immersed at least¼” (a quarter of an inch) deep in the solution. If no wiper is present,gently agitate the instrument to dispel any air bubbles.<strong>TROLL</strong> <strong>9500</strong> Operator’s <strong>Manual</strong> 1250095110 rev. 007 01/09
Section 18: Turbidity3. Connect the MP <strong>TROLL</strong> <strong>9500</strong> to a PC and establish a connectionin Win-Situ 4 or Pocket-Situ 4. Win-Situ screens are illustratedhere. The Pocket-Situ interface is similar, with the Navigation treeat the top of the screen and the Information pane below it.4. Select the MP <strong>TROLL</strong> <strong>9500</strong> in the Navigation tree.The installed sensors will be displayed—including the turbiditywiper, if installed in port P3.5. Click to select Turbidity in the Parameters list. The sensor serialnumber (S/N) and recent calibration information is displayed.• Single-Point Calibration. Click Next and go to step 12.• Standard Calibration (default).8. If you selected a Standard Calibration, select an operational rangetarget. The ranges are suggestions only; a 1- to 4-point calibrationmay be performed in any range, using any standardsNote: If the software detects a turbidity wiper accessory, pressingthe Wipe button will result in one complete wipe cycle of theturbidity sensor optics.9. Select Next to continue.10. In the next screen, select the number of calibration points for thiscalibration, and the turbidity value (in NTU) of the calibration solutionfor each point. One to four points (solutions) may be selectedfor any operational range target selected in the previous screen.51066. Select Calibrate.The Turbidity Calibration Wizard starts. A screen like the one belowis displayed.1178When performing a multi-point calibration, cal point 1 must betaken in a standard with a value of 0 NTU. Use clear water forthis. Purchased distilled or deionized water will generally measureless than 0.5 NTU. Filtered water will have a lower NTU value.11. Select Next to continue.97. Select the type of calibration you wish to do:• Use Default Coefficients resets the factory defaults. If you selectthis option, click Next and proceed to step 17.<strong>TROLL</strong> <strong>9500</strong> Operator’s <strong>Manual</strong> 1260095110 rev. 007 01/09
Section 18: TurbidityA screen similar to the one shown below is displayed.1312. If you are performing performing a single-point calibration, enterthe value of the calibration standard (NTU). For a multi-pointcalibration, the value of the first solution will be displayed.13. When the sensor is situated in the calibration medium, select Runto begin the stabilization.1214. If doing a one-point calibration, go to step 17.For a multi-point calibration, the Wizard returns to the screenshown at step 13 and waits for you to situate the probe in the nextcalibration solution and click Run.15. Discard the first solution, rinse the beaker and the front end of theinstrument thoroughly, wipe off excess water, refill the beaker withthe second solution, and insert the MP <strong>TROLL</strong> <strong>9500</strong> as before.16. Select Run to begin the stabilization for the second calibrationpoint. Status indicators and controls are the same as for the firstcalibration point (step 13).Again wait for stabilization, dump, rinse, dry, refill, Run, as manytimes as necessary to collect a stable calibration point in eachsolution.17. The final screen shows the sensor slope and offset calculated duringthe calibration process (or the default settings if you selectedthat option at step 7). A slope and offset will be shown for eachcalibration point.The display will continuously update as readings are taken andcompared against the stabilization criteria.• Status indicators:NOT TESTED is displayed until you begin the calibration byselecting Run.UNSTABLE indicates the sensor response does not meet thecriteria for a valid calibration point.NOMINAL indicates the sensor deviation meets early stabilizationcriteria.The Accept button becomes available when nominal stability isachieved. You may accept the early value, or wait for completestability. If you accept the early value, the calibration point willbe designated “USER SET” in the calibration report. (For moreon calibration reports, see “Calibration History” in Section 10.)STABLE is displayed when the readings have stabilized sufficientlyto take a valid calibration point. The calibration proceedsautomatically to the next screen.• Sensor Reading: The current sensor response in NTU• Sensor Deviation: Change in sensor response between the last tworeadings.“Pivot” designates the point at which the slope characteristicschange with a multi-point calibration. The correct slope for theturbidity values being monitored will automatically be applied.18. Select Finish to program the sensor with the newly calculatedcalibration coefficients.TIP: You can look at the calibration report right aftercalibrating, or at any time. See “Calibration History” inSection 10 for details.18• Temperature<strong>TROLL</strong> <strong>9500</strong> Operator’s <strong>Manual</strong> 1270095110 rev. 007 01/09
Section 18: TurbidityResetting Default CoefficientsThe sensor’s calibration may be reset back to factory defaults at anytime. As long as there is no contamination on the optical windows, thiswill restore the factory accuracy (± 5% or 2 NTU).1. Establish a connection to the instrument in Win-Situ 4 or Pocket-Situ 4.2. Select Turbidity in the Parameters list and click Calibrate.3. In the first screen, select Use Default Coefficients, then Next.4. In the final screen, click Finish to restore the sensor’s factorycalibration coefficients.Sensor Slope and OffsetThe offset is factory-set at 0 NTU. The zero offset may be recalculatedfor any appropriate value by performing a single-point calibrationusing a calibration standard of the desired NTU value. The sensorresponse is very linear up to 200 NTU.Units and Calculated MeasurementsTwo units are available for readings from the turbidity channel:• NTUs—Nephelometric Turbidity Units. Select NTU when the sensorhas been calibrated with polymer suspensions.• FNUs—Formazin Turbidity Units. Select FNU when the sensor hasbeen calibrated with Formazin.Usage Recommendations and CautionsThe operational pressure rating of the turbidit y sensor is150 psi. Do not submerge it deeper than 346 ft (105 m).Avoid use of the stirrer accessory (recommended for monitoring dissolvedoxygen in stagnant water) when measuring turbidity.When used without a wiper, dirty sensor optics can be compensatedfor to some extent by changing the offset.Optical absorbancy (“color”) will lessen the turbidity signal.Turbidity readings are temperature-commpensated.The optics need 5 seconds warm-up time to take the first readinglater. Subsequent readings can be returned instantaneously.Common InterferencesLight scattering depends upon the size, shape, refractive index, andother characteristics of the particles and the wavelength of the light.Optically black particles, such as those of activated carbon, mayabsorb light and effectively decrease turbidity measurements.Nephelometers are relatively unaffected by small changes in designparameters and therefore are specified as the standard instrument formeasurement of low turbidities. Nonstandard turbidimeters, such asforward-scattering devices, are more sensitive than nephelometers tothe presence of larger particles and are useful for process monitoring.Reported turbidities are heavily dependent on the particulate mattercontained in the suspensions that are used to prepare instrumentcalibration curves.Due to current technological limitations, field turbidity measurementis “a snapshot of averages,” Field measurements can be an excellentindicator of in-situ turbidity; final determination for reporting purposesshould be conducted in a laboratory.Profiling TurbidityThe turbidity sensor’s 5-second warmup will result in a slight delay beforethe first Profiler reading for all parameters. Subsequent readingscan be taken within the Profiler’s 2-second cycling.If a turbidity wiper accessory is installed, it performs an initial wipe ofthe sensor optics—this takes about 15 seconds—then displays thefirst turbidity reading. If the profiling rate is longer than 15 seconds,this 15 second wipe will happen before each reading. To avoid thisdelay, set the profiling rate to less than 15 seconds. See Customizingthe Profiler in Section 5 for details.Logging Turbidity DataThe wiper is activated automatically before turbidity readings duringtests, so long as the readings are 15 seconds or more apart. Toprolong battery life when running a wiper, we recommend the useof external power or two internal lithium D-cells installed in the MP<strong>TROLL</strong> <strong>9500</strong>.Sensor CareInspection/Maintenance/CleaningThe optical windows of the sensor are made of scratch-resistantsapphire. The optical components are not user-serviceable. Seriousmechanical and temperature shock are about the only things that candamage the LED. If you feel the instrument has suffered such damage,contact In-Situ Technical Support.However, the windows may need frequent cleaning, especially if usedin a biologically active environment. A wiper accessory can help toprevent the accumulation of foreign material.<strong>TROLL</strong> <strong>9500</strong> Operator’s <strong>Manual</strong> 1280095110 rev. 007 01/09
Section 18: TurbidityCleaning may be necessary if the optical windows of the sensorbecome visibly contaminated by the gradual accumulation of foreignmaterial. Because the sensor is not removable, we recommend gentleswabbing of the windows with a circular motion using plain water.Solvents are not recommended, although an ammonia solution (e.g.,grocery-store ammonia) may be used with good effect to removeparticularly stubborn materials.A calibration check should be performed after cleaning, using calibrationstandards.Wiper MaintenanceThe cotton wiper pad will require replacement periodically to maintainits effectiveness in cleaning the turbidity sensor optics. The entirehead may be replaced, or just the pad. In either case, the wiper headwill need to be removed. A hex wrench is supplied for this purpose.You do not need to remove the entire wiper; leave the wiper bodyinstalled in port 3.Replacement pads and wiper headsare available from In-Situ Inc. or yourdistributor.Removing the Wiper HeadWith the wiper parked over port 4, loosenthe set screw on the wiper head until youcan grasp the wiper head and gently pullit out.Replacing the Wiper PadTo remove the wiper head,use the supplied hex wrenchto loosen the set screw1. Remove the wiper head as above. Remove and discard the usedpad.2. Insert a new pad into the slots with the smooth side facing out, andpull to eliminate slack. Excess material may be trimmed close tothe wiper head.3. Position the head on the motor shaft with the pad facing down towardthe sensors. The button at the top of the shaft should be flushwith the wiper head surface. Tighten the set screw against the flatof the motor shaft. Be very careful not to move the wiper headin a lateral direction by hand after tightening.4. If convenient, connect in software, select the wiper, and click Wipeto ensure the wiper passes over the turbidity sensor optics properly.Adjusting Wiper PressureIf necessary, loosen the set screw on the wiper head and gently pullthe head up or press down lightly to ensure the pad just brushes theoptical windows when it passes over the turbidity sensor. Then retightenthe set screw. Be very careful not to move the wiper headin a lateral direction by hand when engaged with the motor shaft.TIP: The wiper head is at the best height when it justbrushes the optical windows of the turbidity sensor—too highand it will not clean effectively; too low and it may not be able to spin.If it is necessary to remove the entire wiper assembly, besure to use the sensor removal tool and grasp the body ofthe wiper. Do not attempt to pull the wiper out by the head.Wiper Replacement PartsCatalog No.Replacement wiper head ....................................................... 0044520Wiper pad replacement kit...................................................... 0044530ReferencesASTM method D1889-88(A)Eaton, A.D., L.S. Clesceri, E.W. Rice, and A.E. Greenberg, eds.,Standard Methods for the Examination of Water and Wastewater,21st edition, Washington, D.C.: American Public Health Association,American Water Works Association, and Water EnvironmentFederation, 2005. Section 2130, Turbidity.EPA, Methods for Chemical Analysis of Water and Wastes,EPA/600/4-79-020, revised March 1983. Method 180.1, Turbidity,Nephelometric. Approved at 40 CFR Part 136.EPA, Methods for the Determination of Inorganic Substances in<strong>Environmental</strong> Samples, EPA/600/R-93-100, August 1993. Method180.1, Determination of Turbidity by Nephelometry, Revision 2.0.Approved at 40 CFR Part 141.International Organization for Standardization (ISO), 1999. WaterQuality—Determination of Turbidity, Method 7027.Nollet, Leo M. L., ed. Handbook of Water Analysis. Marcel DekkerInc., New York, 2000.U.S. Geological Survey, Methods for Analysis of Inorganic Substancesin Water and Fluvial Sediments, U.S. Department of the Interior,Techniques of Water-Resources Investigations of the U.S. GeologicalSurvey, I-3860-85.<strong>TROLL</strong> <strong>9500</strong> Operator’s <strong>Manual</strong> 1290095110 rev. 007 01/09
Multi-ParameterWater Quality <strong>TROLL</strong> ®19 SDI-12 OperationSDI-12 is a serial digital interface that operates at 1200 baud. In-Situ’sSDI-12 Adapter enables processing of the MP <strong>TROLL</strong> <strong>9500</strong>’s sensormeasurements by a standard SDI-12 data recorder.SDI-12 Requirements• MP <strong>TROLL</strong> <strong>9500</strong> (firmware 1.54 or later)• SDI-12 Adapter (for proper power management)• SDI-12 data recorder (customer-supplied)WiringConnect the stripped and tinned wires from the SDI-12Adapter to the terminal block of an SDI-12 data recorder (orto an SDI-12 network) as follows.• WHITE - serial data line• BLACK - ground line• RED - 12-volt supply line• GREEN - shieldThe data recorder or an external power supply may provide power(9.6 - 16 V) to the 12V line. The shield should be terminated (grounded)at the data recorder.Minimum voltage supplied per the SDI-12 specification (9.6V) issufficient to power a <strong>TROLL</strong> <strong>9500</strong> on 170 ft (52 m) of RuggedCable.Cables as long as 300 ft (91 m) may be used, depending on powersupplied. Before using cables longer than 170 ft (52 m) we recommendthat you measure the voltage at the Adapter. The table listspower requirements for specific submersible cable lengths.ConnectionsAttach the Twist-Lock Connector on the MP <strong>TROLL</strong>’s RuggedCable tothe matching connector on the SDI-12 Adapter.The Adapter is weather-resistant but not completely waterproof. It isnot designed to be exposed to the elements. Provide a weather-resistantenclosure for optimum operation.Table 19-1. Cable length & power supply requirementsSDI-12 SupportCable length Power supplyfeet meters requirement170 52 9.6 V180 55 9.8 V190 58 9.9 V200 61 10.1 V210 64 10.3 V220 67 10.4 V230 70 10.6 V240 73 10.8 V250 76 10.9 V260 79 11.1 V270 82 11.3 V280 85 11.4 V290 88 11.6 V300 91 11.8 VThe MP <strong>TROLL</strong> <strong>9500</strong> supports the SDI-12 Version 1.3 commands.Data loggers that support SDI-12 Version 1.3 can usually send theVersion 1.3 commands to an SDI-12 “sensor” like the MP <strong>TROLL</strong>automatically. These commands are listed later in this section. Additionalinformation may be found in an SDI-12 reference, such as thatlisted at the end of this section. Or consult your SDI-12 data loggerdocumentation for more specific information.Insure SDI-12 is enabled (factory default) on the <strong>9500</strong>. InWin-Situ 4 or Pocket-Situ 4, select the <strong>TROLL</strong>, click Edit...select SDI-12 Mode Preferences.Calibration of the water-quality sensors will need to be donethrough Win-Situ 4 or Pocket-Situ 4 as SDI-12 protocols donot support calibration.<strong>TROLL</strong> <strong>9500</strong> Operator’s <strong>Manual</strong> 1300095110 rev. 007 01/09
Section 19: SDI-12 OperationSensor IdentificationIn response to the “send identification” command, the MP <strong>TROLL</strong><strong>9500</strong> will respond as follows:The default sensor address is 0. The device supports softwarechangeableaddresses.013IN-SITU WQP100154030452 Serial numberFirmware versionSensor (MP <strong>TROLL</strong> <strong>9500</strong>) modelManufacturer (In-Situ Inc.)SDI-12 compatability (version 1.3)Sensor addressSensor VerificationIn response to the Verification command, the MP <strong>TROLL</strong> <strong>9500</strong> willrespond as follows:0+030452+30+1.54+3.0+5+3.0+4.5 External power voltageBattery voltageBattery type (0=none, 5=alkaline, 6=lithium)Hardware version (1 decimal place)Firmware version (2 decimal places)2-digit entity codeSerial numberSensor addressMaking SDI-12 MeasurementsWhen measurements are made they will be taken on all sensors installedin the MP <strong>TROLL</strong> <strong>9500</strong>. “Derived” or calculated measurements,available in Win-Situ, are reported in SDI-12 for D.O. and conductivity.For example, the D.O. sensors can report oxygen concentration inmilligrams per liter and saturation in percent. Specific conductance isreported as well as conductivity.TIP: SDI-12 protocols use the term “sensor” for a single SDI-12 device with an address. In this usage, the MP <strong>TROLL</strong><strong>9500</strong> is a “sensor,” even though it includes up to 11 installed“sensors” in the In-Situ usage. The “sensors” in the In-Situ usagecannot be addressed individually using SDI-12 protocols.The default order in which parameters are reported, and the units foreach parameter, are listed in Table 19-2.TIP: You can change the default order of parametersreported in Win-Situ or Pocket-Situ like this:1. Select the MP <strong>TROLL</strong> in the Navigation tree2. Select Edit3. In the dialog box, select “SDI-12 mode preferences”According to the SDI-12 specification the Start Measurement command“aM!” can take up to 9 measurements. Since the MP <strong>TROLL</strong><strong>9500</strong> can potentially report more than 9 measurements there are twoapproaches to measuring all sensors:• Use the Start Concurrent Measurement command (“aC!”). Thiscommand supports up to 20 measurements.• Use the Start Additional Measurement commands (“aMn!”). Thelogger would first issue an “aM!” command. If the commandresponds with 9 measurements then the logger will send an “aM1!”command (after reading the initial measurements with the “aD0!”command), and read the measurements with the “aD0!” command.This process is repeated, progressing through the value of “n”, untilthe “aMn!” command responds with less than 9 measurements.When parameters are read back over the SDI-12 bus via one of the“aDn!” commands they will be reported in a fixed order (Table 19-2).If a unit has duplicate transducers, only one will be reported underthis fixed-order reporting, by order of the port it is plugged into. Forexample, if two pH sensors are plugged into ports 1 and 3, the sensorin port 1 will be reported.Note that the fixed reporting order can be changed as as described inthe tip ✔ on this page.A measurement is returned for all possible MP <strong>TROLL</strong> parameters.Table 19-2. SDI-12 Parameter Reporting (Default Order)Order Parameter Unit1 Pressure PSI2 Temperature degrees Celsius3 Barometric Pressure PSI4 Turbidity NTU5 pH pH6 ORP milliVolts7 Conductivity (Actual) µS/cm8 D.O. (Polarographic) mg/L9 Battery Voltage volts10 Nitrate ppm11 Ammonium ppm12 Chloride ppm13 RDO (Optical D.O.) mg/L14 Conductivity (Specific) µS/cm15 Salinity PSU16 D.O. (Polarographic) % saturation17 RDO (Optical D.O.) % saturation18 Ammonia ppm19 Total Dissolved Solids g/L20 Resistivity kOhm-cm<strong>TROLL</strong> <strong>9500</strong> Operator’s <strong>Manual</strong> 1310095110 rev. 007 01/09
Section 19: SDI-12 Operation• If a sensor port is empty, the unit will report readings with values of0.0.• If you edit the device to set SDI-12 mode preferences, as describedin the tip ✔ above, only the parameters you select will bereported.• If a sensor is reading out of its range, a value of -999999.9 will bereported.Redundant Logging (Win-Situ 4 and SDI-12)If your MP <strong>TROLL</strong> <strong>9500</strong> supports internal logging, the instrument iscapable of running tests (programmed in Win-Situ) while participatingin an SDI-12 network; however Win-Situ cannot communicate with theMP <strong>TROLL</strong> <strong>9500</strong> while it is trans mitting SDI-12 data, and conversely,the instrument cannot receive or respond to SDI-12 commands whileconnected to a PC serial port.This “redundant logging” feature means• if the SDI-12 recorder somehow “loses” data, the MP <strong>TROLL</strong> <strong>9500</strong>data can be retrieved using Win-Situ.* if the SDI-12 recorder ceases to function due to power loss, the MP<strong>TROLL</strong> <strong>9500</strong> will continue to collect new data using its own internalbatteries and clock.Extended (ISCO) CommandsExtended commands allow the data sampler to identify both the datachannels and channel units that correspond to the ASCII formattedfloating point data being returned. In response to the “aXPR0!” command,the response will be in the form: “aIxIxIx...” where ‘a’is the address, each ‘I’ is a parameter identifier, and each ‘x’ specifiesthe units for the preceding ‘I’.The data sampler will first issue either a measure or a concurrentmeasure command. These commands return the number of channelsthat will be reported in a subsequent read command. This numberwill correspond with the number of pairs returned by the extendedcommands.If the expected number of “Ix” pairs is not returned in response to the“aXPR0!” command, additional “aXPRx!” commands will be issueduntil all pairs are received.ReferenceSDI-12, A Serial-Digital Interface Standard for Microprocessor-BasedSensors, version 1.3. SDI-12 Support Group, Logan, Utah, April 7,2000. Available at www.sdi-12.org.TIP: Depending on the SDI-12 data recorder used, rapidsample schedules during a test may result in SDI-12“retries.”<strong>TROLL</strong> <strong>9500</strong> Operator’s <strong>Manual</strong> 1320095110 rev. 007 01/09
Section 19: SDI-12 OperationSDI-12 V 1.3 Command SetName Command Response & CommentsAddress Query ?! aThe wildcard address ‘?’ character is supported only for the Address Querycommand. It is ignored as an invalid address for all other commandsAcknowledge Active a! aBasic address characters in the range ‘0’ to ‘9’ and extended address charactersin the ranges ‘A’ to ‘Z’ and ‘a’ to ‘z’ are supported. All other characters areignored as an invalid address. The default address is ‘0’Change Address aAb! bSoftware changeable addresses and the Change Address command aresupportedSend Identification aI! 013IN-SITU WQP100vvvxxxxxwhere vvv = device firmware ∗ 100 (153 = 1.53)xxxxx = 5-digit device serial numberStart Verification* aV! 00001One result is available immediately for reading by the Send Data commandSend Data aD0! . . . aD9! 0+030452+30+1.53+3.0+5+3.0+4.5 Address + serial no. + 2-digit entity code + firmware version (2 decimalplaces) + hardware version (1 decimal place) + battery type (0=none, 5=internalalkaline, 6=internal lithium) + battery voltage (1 decimal place) + externalpower voltage (1 decimal place)Start Measurement* aM! 0001nStart Measurement with CRC aMC! n parameters will be available for reading by the Send Data command within1 second. A service request (a) will be sent when the parametersare ready. The number of parameters returned is determined by the SDI-12defaults shown in Table 19-2 (or edit the SDI-12 mode preferences)Send Data aD0! . . . aD9! a or aAdditional Measurements* aM1! . . . aM9! atttnAdditional Measurements with CRC aMC1! ... aMC9! atttnSend Data aD0! . . . aD9! a or aStart Concurrent Measurement aC! atttnnStart Concurrent Measurement with CRC aCC! atttnnSend Data aD0! . . . aD9! a or aAdditional Concurrent Measurements aC1! . . .aC9! atttnnAdditional Concurrent Measurements with CRC aCC1! ... aCC9! atttnnExtended CommandsISCO Compatability aXPR0! ... aXPR9! aIxIxIxIxwhere each Ix is a character pair identifying the parameter and units for eachmeasurement. The number of Ix pairs equals the number of data valuesreturned for the Start Measurement and Start Concurrent commands, limitedto 19 per command. If the expected number of “Ix” pairs is not returned inresponse to the “aXPR0!” command, additional “aXPRx!” commands will beissued until all pairs are received* This command may result in a service request.a Sensor address ! Command terminator Response terminatorttt Time (seconds) until measurement is ready n, nn Number of measurement values<strong>TROLL</strong> <strong>9500</strong> Operator’s <strong>Manual</strong> 1330095110 rev. 007 01/09
Section 19: SDI-12 OperationSDI-12 Schematic Installation Diagramup to 200 ft (61 m)SDI-12 Data Recorder(customersupplied)Adapterto another SDI-12deviceup to 300 ft (91 m) RuggedCable;see Table 19-1 for powerrequirements of cables longer than170 ft (52 m)MP<strong>TROLL</strong><strong>9500</strong><strong>TROLL</strong> <strong>9500</strong> Operator’s <strong>Manual</strong> 1340095110 rev. 007 01/09
Multi-ParameterWater Quality <strong>TROLL</strong> ®20 Low-Flow MonitoringGroundwater that has sat in a well casing for a period of time may notadequately represent the formation water. Well purging can ensurethat fresh formation water is drawn into the casing for representativemeasurement of water temperature, pH, conductivity, and otherparameters. The well may be pumped to remove a predeterminednumber of volumes of stagnant water from the well.A more cost- and time-effective method of purging involves pumpingat very low flow rates with concurrent monitoring of water quality indicatorparameters until it is determined that true formation water is beingmonitored. The Flow-Sense Wizard in Win-Situ 4 and Pocket-Situ4 automates this process to help determine when a representativesample of formation water can be collected from a well for analysis.Based on user input, the software calculates the volume of theIn-Situ flow cell and tubing, and the time to exchange one completevolume at the specified pumping rate. The frequency of measuringthe water-quality indicator parameters is based on the time requiredto completely evacuate one volume of the flow cell and tubing. Meterand graphical views help to determine when the change in parameterreadings falls within the specified target range.InFlowMP <strong>TROLL</strong> <strong>9500</strong>Flow cell for sub-4” <strong>TROLL</strong> <strong>9500</strong>OutFlowPreparation• Install Win-Situ 4 from the software CD or In-Situ website• Install Pocket-Situ 4 to your desktop/laptop PC from the CD orwebsite, connect the computers in ActiveSync ® , launch the Win-Situ Software Manager, and follow the instructions to install Pocket-Situ 4 on the RuggedReaderTIP: When using the RDO sensor for low-flow monitoring, besure to install the most recent version of Win-Situ 4 andPocket-Situ 4, available at www.in-situ.com.• Calibrate the water-quality sensors• Have the following site information ready to enter in the softwarewhen prompted by the Flow-Sense Wizard:• Well diameter and total depth • Screen length• Depth to water level, top of screen and placement of pumpintake, referenced to a benchmark• Pump model & type• Tubing type• Tubing inner diameter • Tubing lengthRDO Sensor PreparationSpecial preparation is in order if you plan to use the sub-4” RDO ® opticaldissolved oxygen sensor for low-flow monitoring. You will need:RDO Optical Dissolved Oxygen sensor.................................. 0085070Flow Cell for use with RDO sensor......................................... 0057600The RDO-ready flow cell includes hardware fittings for setting up theflow cell and installing the RDO sensor.Prepare the Flow CellConnect valves and tubing to flow cell body. Attach spike or baseplate. Insert the calibrated <strong>TROLL</strong> <strong>9500</strong> into the flow cell. Turn on thepump.Flow cell for sub-2” <strong>TROLL</strong> <strong>9500</strong><strong>TROLL</strong> <strong>9500</strong> Operator’s <strong>Manual</strong> 1350095110 rev. 007 01/09
Section 20: Low-Flow MonitoringConfigure the Flow-Sense Wizard in the OfficeText entry on a PDA in the field can be tedius. To simplify the task, we suggestyou run the Flow-Sense Wizard using Win-Situ 4 on a full-sized PC inthe office to prime the software with representative values. Then use Win-SituSync to copy the “templates” created in this way to the PDA.A Connect the <strong>TROLL</strong> <strong>9500</strong> you will use in the field to your desktop PC. Thedevice can be in air since the sampled data are not important.B For each well you need to sample, execute the Wizard as described onthe following pages. The more information you can enter in advance, theless you will have to tap in later with a stylus outdoors.C Estimate any values you do not yet know (e.g., tubing length, pumpingrate, final drawdown).Start the SoftwareConnect the <strong>TROLL</strong> <strong>9500</strong> to the PC or PDA. Launch Win-Situ 4 orPocket-Situ 4. If you have not used the software before, take a momentto specify a connection type, COM port, and baud rate in theConnection Wizard.Launch the Flow-Sense Wizard1. Select one of the following ways to launch the Flow-Sense Wizard:• Tools Menu: Select the Flow-Sense Wizard (not available inPocket-Situ)• Navigation Tree: (a) Select the Flow-Sense Wizard in theNavigation tree; (b) Click or tap Start in the Information pane.a• If you’ve used the Flow-Sense Wizard before—or copied“template” files from a different PC—expand the Flow-SenseWizard folder by clicking on the +, then expand the Flow-SenseData folder. (a) Select a file or template. (b) Click or tap Start.bD Let the stabilization phase run for at least one reading, then Accept.E When the Wizard asks if you want to save the file, give each one a meaningfulname, for example:“Well A template.flo”“Well B template.flo”F On your next ActiveSync connection, In-Situ’s synchronization utility Win-Situ Sync will prompt you for Low Flow templates you wish to transfer tothe PDATIP: If Win-Situ Sync does not launch automatically, select itfrom the In-Situ Inc. group in Programs on the WindowsStart Menu. Be sure the option Transfer data files fromDesktop to Field Unit is checked . Click to transfer files..Input values from that file or template will be copied.aCompany Name: Water WestProject Name: Central ValleySite Name: New West WellWell ID: 1562bVerify Unit PreferencesBefore the Flow-Sense Wizard starts, you may wish to verify the currentunit selections. Length measurements in the Flow-Sense Wizarddefault to metric (meters, centimeters), but you can enter and displaythis data in English units (feet, inches) if you prefer. You may also wishto verify the units for Conductivity, Dissolved Oxygen, ORP, pH, Temperature,and Turbidity.TIP: Flow units in the Flow-Sense Wizard will always be inmilliliters (mL). For best results, units should be consistentbetween the desktop application and the PDA application.To skip the settings verification, click Continue.The Wizard will open the COM port and connect to the instrument.If you have used the Wizard before, or launched the Wizard from anexisting .flo file, data entry values will be supplied.TIP: The Wizard opens the COM port you used last (this isstored in the Wizards.ini file in the Config subfolder in thefolder where Win-Situ is installed).If several connections have been used in the past, the Wizard usesthe first “direct” connection it encounters in the tree.If the Wizard is started without any connection information at all, itwill attempt to connect using COM 1 at a baud rate of 19200.<strong>TROLL</strong> <strong>9500</strong> Operator’s <strong>Manual</strong> 1360095110 rev. 007 01/09
Section 20: Low-Flow MonitoringFlow-Sense Wizard Input1. The first input screen provides for entry of specific details about theproject. This information will be included in the output report. TheProject Name and Site Name will appear in the output file name.3. In the next screen, enter details about the pump and tubing(tubing information is used in later volume calculations). Ifcreating a template, estimate the tubing length and pumpplacement.31Click or tap Next to continue.2. In the next screen, enter information about the well. This informationwill be included in the output report. The Well ID will appear inthe output file name.2Click or tap Next to continue.The next screen requests pumping information4. Final pumping rate: Enter in milliliters per minute. If creating atemplate, accept the default or estimate the pumping rate.5. Total volume—Auto Calculated Value: This is the softwarecalculatedvolume of the cup (flow cell) and tubing, less thedisplacement of installed sensors.45Click or tap Next to continue.To specify a different volume, clear the “Auto” check box, andenter the new volume (mL).<strong>TROLL</strong> <strong>9500</strong> Operator’s <strong>Manual</strong>137 0095110 rev. 007 01/09
Section 20: Low-Flow Monitoring6. Measurement interval—Auto Calculated Value: This is thesoftware-calculated time (seconds) for one complete exchange ofwater in the calculated volume at the final pumping rate. In otherwords, this is the time required to completely evacuate one volumeof the flow cell and tubing and draw in a new volume. Readings willbe taken at this interval unless you specify a different interval.TIP: If you want to enter percent values in the right column,enter “1” as a default value in the absolute (middle) column.The percentage range is calculated by the formula:max - min of last 3 readings×last reading100%9. If you wish to add comments, click the Notes button. They will beincluded in the output report.10. Ensure the pump is on (unless you are creating a template), thenclick or tap Start to begin the stabilization readings.The sidebar on page 139 describes the stabilization readingsscreen that is shown next.6711. When the readings appear stable, you are ready to save the dataand exit the software. Click or tap Accept.If creating a template, let the stabilization phase run for at leastone reading, then click Accept.Saving the Low-Flow Data or TemplateTo specify a different interval, clear the “Auto” check box as shownabove, and enter the desired measurement interval (seconds).7. Stabilized drawdown: Final drawdown from the initial water levelentered previously (measured with tape after pumping starts). Ifcreating a template, estimate the final drawdown.Click or tap Next to continue.8. The final screen displays the available parameters. Choose theparameters to monitor and the target stability range for eachparameter. You can enter absolute values in parameter units orpercentage values8Click Save when a suggested output file name is displayed. You maychange this name if you like. After it is saved, the file will be displayedin the Data Folder branch of the Navigation tree and will open inthe Information pane, like other test files extracted in Win-Situ 4 orPocket-Situ 4.The file may be displayed in report format or as a graph in both Win-Situ 4 and Pocket-Situ 4. (If you can’t see much on the PDA screen,try scrolling to the right.) The top of the file presents well, site, andproject information. At the end of the file are the measurement data.Additional functions are available through Win-Situ 4.• Print (file menu)• Graph (button in Information pane). However, note that bettergraphical report output is available if you export to Excel.• Save as text file (file menu)• Export to Excel (file menu)910<strong>TROLL</strong> <strong>9500</strong> Operator’s <strong>Manual</strong>138 0095110 rev. 007 01/09
Section 20: Low-Flow MonitoringOutputLow-Flow files are saved as files of type .flo in a folder named Flow-Sense Data under the Flow-Sense Wizard folder, and are accessiblein the Navigation tree. By default they are named as shown below:Stabilization Readings—Meter and GraphFlow-Sense Data \ Central Valley-New West Well-1562-6-10-2007.floProject nameSite nameWell IDDate (m-dd-yyyy)Low flow file designatorExport to Excel OptionTo automatically create an output report in Microsoft ® Excel ® fromWin-Situ 4:1. In the Win-Situ Navigation tree, select a low-flow data file. If itopens in Graph view, select the Report button.2. On the Win-Situ File Menu, select Export to Excel.3. The report will open in an Excel spreadsheet.Using a Custom Excel TemplateThe Win-Situ 4 installation includes an Excel template for creating anoutput report (shown on the following page). This template is namedInSituLowFlow.xlt, and is automatically installed to the Templatesdirectory of the Microsoft operating system. Brief instructions for usingthis template are included in the spreadsheet that opens when youselect Export to Excel.To format an output report using the custom template,1. After exporting a low flow data file to Excel, insert a new sheetbased on a template by right-clicking the tab at the bottom of thescreen in Excel.2. Click Insert, then select the template InSituLowFlow.xlt.3. When prompted by Excel, select “Enable Macros.”An example of low flow data formatted in Excel using this templateis shown on the following page.4. If desired, save the report as an .xls file.No. of readings takenTime the Wizard started11Countdown to next readingElapsed time• Reading: the current reading• Change - Val: difference between the maxium and minimumover the last 3 readings OR• Change - %: difference between the current reading and thethird reading back, expressed as a percentage• Target specified earlier in the Wizard (shown for Values)To view this data in graphical form, click Graph.The graph shows the changeand stabilization ranges ofall parameters. The “changeband,” between the heavydotted lines, represents acomposite target of all specifiedstability ranges. You candrag the range finder up ordown, or expand the stabilityregion to zoom in.The most recent readingsare shown on the right, earlierreadings on the left. 0marks the latest reading. Thechange band is centered onthe third point as a reference.The graph can show up to10 sets of readings. Changeis recalculated with eachreading.Graph view of unstable change11Graph view of stabilized change<strong>TROLL</strong> <strong>9500</strong> Operator’s <strong>Manual</strong>139 0095110 rev. 007 01/09
Section 20: Low-Flow MonitoringSample of a Low-Flow output report using the Export to Excel function and the In-Situ template InSituLowFlow.xlt. Normalized data = change in indicator parameters mapped from 0 to 1. A graph may be generated usingWin-Situ 4 and inserted manually into the report, if desired.<strong>TROLL</strong> <strong>9500</strong> Operator’s <strong>Manual</strong> 1400095110 rev. 007 01/09
Multi-ParameterWater Quality <strong>TROLL</strong> ®21 Care & MaintenanceReplacing BatteriesThe MP <strong>TROLL</strong> <strong>9500</strong> uses—• two standard 1.5V alkaline D cells, or• two 3.6V lithium D cells—recommended for use with an RDOoptical dissolved oxygen sensor, and with a turbidity wiperUse only Saft LSH-20 3.6V lithium D cells. Use of anyother lithium battery will void the product warranty.Battery voltage and approximate percentage remaining is displayedin the software interface when the instrument is connected to a PC.Note: Due to the voltage supplied by two lithium D cells, the softwaremay report that the <strong>TROLL</strong> <strong>9500</strong> is operating on external power.To replace batteries:1. Unscrew and remove the white battery compartmentcover. If the cable is attached, slide thebattery compartment cover up onto the cable.2. Press down slightly on the top battery to remove it,or knock it out gently into your hand.3. Tip the unit to slide the bottom battery out.4. Insert the new batteries according to the diagramon the inside of the battery compartment(positive up for both).5. Slide the white cover back down over the battery compartment andhand-tighten to thread it to the instrument body.Screw the cover down firmly to compress the o-rings andcreate a waterproof seal. When properly assembled, theo-rings will not be vsible.6. At your next software connection in Win-Situ 4 or Pocket-Situ 4,edit the device to update the battery information. (See “Editing theDevice Properties” in Section 4.)O-Ring SealsLubricationInsert batteries negative side first,positive side upThe Viton ® o-rings used in the MP <strong>TROLL</strong> <strong>9500</strong> and other submersibleIn-Situ instruments are crucial to insure the integrity of the watertightseal. We recommend that you inspect them each time they arestressed (insertion/removal of sensors, attachment/removal of therestrictor, battery replacement, etc.) for any indication of dirt, cracks,tears, splitting, shredding, desiccation, and other damage. If the o-rings are in good condition, apply silicone lubricant before re-assemblingthe instrument. Remove excess lubricant with a lint-free tissue.If the o-rings are damaged, they should be replaced, as describedbelow.When lubricating the sensor o-rings, take special care to keep greaseaway from the area around the connector at the bottom of the sensors.Should lubricant get into this area, remove it with a clean cottonswab.<strong>TROLL</strong> <strong>9500</strong> Operator’s <strong>Manual</strong> 1410095110 rev. 007 01/09
Section 21: Care & MaintenanceReplacementIf the o-rings become damaged to the extent that no longer provide aneffective seal, they should be replaced. If there is any doubt whetherthe o-rings should be replaced, it is best to err on the side of safetyand replace them.Before replacing o-rings, clean all mating surfaces, including theo-ring grooves.O-rings and lubricant are included in the MP <strong>TROLL</strong> 9000 Maintenancekit available from In-Situ Inc. or your distributor.General CleaningRinse the instrument body well, especially if it has been in contactwith contaminated media. Air-dry or wipe with a lint-free tissue.Ultrasonic cleaning is not recommended.StorageStore the <strong>TROLL</strong> <strong>9500</strong> clean and dry. Place the protective red dustcapon the cable end, or store with cable attached to protect the connectorpins and o-ring.Store the instrument where it will be safe from mechanical shocks thatmay occur, such as rolling off a bench onto a hard surface.Protect the instrument from temperature extremes. Store within a temperaturerange of -40°C to +80°C (-40°F to +176°F).If the sensors are removed for storage, place plugs in the dry sensorports as protection from dust and dirt.Sensor StorageFor long-term storage, return the water-quality sensors to their originalpackaging. Protect the lubricated o-rings from dust and dirt.For up to a week, the sensors may be left in the instrument, with amoist sponge in the bottom of the Cal Cup to provide a moist environmentfor those sensors that require it.Twist-Lock ConnectorsKeep the pins on all connectors free of dirt and moisture by using thesoft protective dustcap when cable is not attached.<strong>TROLL</strong> <strong>9500</strong> Operator’s <strong>Manual</strong>142 0095110 rev. 007 01/09
Multi-ParameterWater Quality <strong>TROLL</strong> ®22 TroubleshootingTroubleshooting ConnectionsProblem: Win-Situ or Pocket-Situ cannot “find” (connect to) the MP<strong>TROLL</strong> <strong>9500</strong>. Error 6146 may be displayed.Probable Cause: Wrong COM port selected, loose cable connections,device is taking a measurement as part of a test, batteriesare low, elastomer is wornSuggested Remedy: Check the following:• all cable connections are tight• the back end is securely attached to the instrument• the correct COM port is selected• the internal battery has voltage remaining; attach externalpower• If a test is running, try connecting again—several times ifnecessary to “sneak” in between test data points.Q:A:The MP <strong>TROLL</strong> <strong>9500</strong> rolled out of the back of my truckand hit the ground pretty hard. It still talks. Is it OK touse?The instrument is pretty rugged, and can survive a fewdrops and rolls. We hope the restrictor was on to protectthe sensors! First, check the joint between the body and therestrictor. It should appear smooth and tight to preserve theintegrity of the water seal. Next, remove the restrictor andinsure the pressure sensor is snug against the sensor block.Push it firmly into the sensor block if you see a gap. If thetemperature sensor is bent, straighten it gently but firmly byhand (no tools, please).If the instrument is dropped repeatedly on the nose cone,check for damage to the batteries.Troubleshooting Data Collection (Tests)Problem: Readings are in the wrong unitsProbable Cause: Default units are being usedSuggested Remedy: Select the desired units on the Win-Situ Optionsmenu, or select the Home site in Pocket-Situ and tap Setup inthe command barProblem: Pocket-Situ hangsSuggested Remedy: Reset the PDA; see your PDA documentationfor details on hard and soft resetProblem: Test ABENDed (came to an “ABnormal END”)Probable Cause: Device lost power or ran out of memorySuggested Remedy: None; indication of ABEND in software cannotbe reversed. but data collected up until the time the test ABENDedis likely to be fineCheck clock, check memory free, check device powerProblem: Scheduled test did not startProbable Cause: Incorrect device clock, full memory, power removedat time of first scheduled data pointSuggested Remedy: Synchronize device clock and reschedule test;insure device has sufficient battery power and free memory; insuredevice is powered at time of first scheduled data point<strong>TROLL</strong> <strong>9500</strong> Operator’s <strong>Manual</strong> 1430095110 rev. 007 01/09
Section 22: TroubleshootingTroubleshooting SensorsProblem: Sensor will not go into portProbable Cause: (1) Insufficient lubrication on sensor o-rings. (2)Incorrect sensor alignment.Suggested Remedy: (1) Generously lubricate sensor o-rings with agood silicone lubricant. Remove excess lubricant with a tissue, andtake care to keep grease away from the area around the connectorat the bottom of the sensor. (2) Align the mark on the side ofthe sensor (it looks like a small white “V”) with the tic mark on thesensor port. If you have trouble locating these marks, visualize thesensor block as a clock face, with the pressure/turbidity sensor orplug at 12:00. The port alignment marks are at the 3:00 position foreach port.Problem: Sensor will not come out of portProbable Cause: Inability to grasp sensorSuggested Remedy: Try the sensor removal tool. Insert it betweenthe widest part of the sensor and the instrument body and pressdown on the handle, prying the sensor up until it pops out.Problem: Software does not recognize sensor in portProbable Cause: (1) Sensor is not firmly seated in port. (2) Excesslubricant or dirt in port. (3) Sensor is in a wrong port for its type.Suggested Remedy: (1) Re-insert the sensor: Align the mark on theside of the sensor (it looks like a small white “V”) with the tic markon the sensor port. Use sensor insertion tool to press sensor firmlyinto port until you feel it dock with the connector. When properlyinserted a only a very small gap (0.060-0.075 inch, the width of thesensor removal tool) remains between the widest part of the sensorand the instrument body. (2) Remove excess lubricant and/or dirtfrom the connector on the sensor and from the connector in theport.(3) Insure the sensor is in the correct port for its type. Somesensors will function properly in any port, others will work only inspecific ports. Refer to diagrams in section 3 or specific sensorsection of this manual. Remove sensor and re-install in correctport, if necessary, then refresh device information in the software.Troubleshooting CalibrationProblem: The Cal Cup leaks when rinsing sensorsProbable Cause: Cal Cup is not tightened to probe body sufficientlyto seat against the o-ringSuggested Remedy: Carefully align threads on Cal Cup with threadson instrument body. Thread the Cal Cup onto the body until it isseated against the o-ring, then back off slightly to avoid overtightening.Problem: The DO readings stabilized during the Quick Cal but nowthe readings are off (too high or too low)Probable Cause: (1) Too much solution in Cal Cup during the QuickCal to expose the DO sensor to air. (2) Cal Cup is too tightly sealedduring calibration.Suggested Remedy: (1) The DO membrane must be exposed to airfor a valid 100% DO calibration. If the membrane is submergedwhen you invert the Cal Cup during the Quick Cal, remove theend cap and pour out some of the calibration solution until themembrane is in air. (2) Loosen the end cap of the inverted Cal Cupduring DO calibration to avoid pressurizing the chamber.<strong>TROLL</strong> <strong>9500</strong> Operator’s <strong>Manual</strong>144 0095110 rev. 007 01/09
Multi-ParameterWater Quality <strong>TROLL</strong> ®AppendixElectronic Drift and Device RecalibrationThe electronics of the Multi-Parameter <strong>TROLL</strong> <strong>9500</strong> will experienceaccuracy drift over time. This drift applies to all channels and is additiveto the initial calibration accuracy. Electronic drift does not apply touser-calibrated sensors because the drift is compensated for duringcalibration.The system wide long-term drift is dominated by the stability of thevoltage reference used in the device. Other components exhibit longtermdrift of a much smaller magnitude.The equation used to calculate drift over time is:D = K ∗ √ (t / 1000 hours)where:D is the drift in ppmK is the long term stability coefficient listed as ppm / 1000 hoursbut actual units are ppmt is the time expressed in hoursUsing this information, the maximum drift over time is shown in thetable on this page.Determining DensityThe density of water in a well can be determined using an accuratetape measure and a pressure transducer. A change in pressure isrecorded between two points as the transducer is lowered into thewater and the corresponding change in depth is recorded using themeasuring tape. Density is then calculated using a simple formula.This method is valid if the pressure and depth measurements areaccurate and the water within the well is homogeneous throughout theentire depth of the well.TIP: The recommended frequency of factory recalibration ofthe MP <strong>TROLL</strong> <strong>9500</strong> depends upon the amount of drift auser is willing to tolerate. For example, if a drift of 0.025% isacceptable, then the recalibration period is 6 months; if a drift of0.05% is acceptable, then the recalibration period is 2 years.<strong>TROLL</strong> <strong>9500</strong> Operator’s <strong>Manual</strong> 1450095110 rev. 007 01/09
AppendixNote: Density can also be measured using a hydrometer if it is possibleto withdraw a water sample from the well. We recommend anaccuracy of ±0.0005.ProcedureThere are two possible methods for measuring the change in waterdepth. Choose the method that is the most convenient and accurate.• Attach the tape measure to the transducer cable using an adhesive(e.g., duct tape). The tape measure can be attached to the transduceritself or to a segment of the cable that will be adjacent to thetop of the well casing. Read the cable positions directly from themeasuring tape. The measuring device must have a resolution ofat least 1 mm or 1/16 in.• Alternatively, mark the positions of the cable with an indelible felttip pen. The distance between marks is then determined with atape measure after the corresponding cable segment is removedfrom the well.1. Lower the transducer into the well until it is submerged under aboutone meter of water.3. Take an electronic pressure reading, manually, from the transducerand record this measurement in PSI. This is measurement P 1.4. Read the tape measure relative to some fixed reference point (e.g.,top of well casing) or mark the position on the cable with an indeliblepen. This is measurement L 1.5. Lower the transducer at least three meters deeper into the waterand repeat steps 3 and 4. These are measurements P 2and L 2.6. Density (ρ) in g/cm 3 is calculated using the following:ρ =(P 2– P 1) x 6.894757g x (L 2- L 1)where g is the gravitational acceleration for the location of the wellin m/s 2 . P must be in PSI units and L must be in meters. If using atape measure calibrated in feet, 1 ft = 0.3048 m (exactly).An error of 0.001 m (1 mm) in the depth measurementtranslates into an error of 0.00085 g/cm 3 for density.2. Secure the transducer at a fixed depth using the cable at the top ofthe well casing. Wait an hour or so for the system to equilibrate.<strong>TROLL</strong> <strong>9500</strong> Operator’s <strong>Manual</strong>146 0095110 rev. 007 01/09
Multi-ParameterWater Quality <strong>TROLL</strong> ®GlossaryABend: Indication in the software interface that a test has come to an“ABnormal END”—usually because the device memory is full, orpower was lost.ABS: Acrylonitrile Butadiene Styrene, a plastic material.Absolute pressure sensor: Non-vented pressure sensor that measuresall pressure forces detected by the strain gauge, including atmosphericpressure. Fluid levels measured with an absolute pressuresensor must be corrected through subtraction of the atmosphericpressure to obtain accurate fluid level measurements. CompareGauged pressure sensor.AC: Absolute or Actual Conductivity.Accuracy: Closeness of agreement between the result of a measurementand the true value. Usually expressed as a deviation from100% accuracy.A/D (analog to digital) converter: Converts an electrical signal to anumeric value that can be interpreted by a computer.Ambient pressure (temperature): The pressure (temperature) of themedium surrounding the sensor or instrument.Ammonia (NH 3): A toxic, colorless gas with a pungent odor, highlywater-soluble.Ammonium (NH 4+): Solvated ammonium cation produced when ammoniagas is dissolved in water.Ammonium chloride (NH 4Cl): A salt used to make ammonium andchloride calibration standards.Anion: Negatively charged ion (e.g., Cl – , NO 3–).Atmospheric pressure: Pressure due to the atmosphere, altitude-dependent.Barometric pressure, see Atmospheric pressureBithermal: At two temperatures, e.g., a three-point calibration of anammonium, chloride, or nitrate sensor conducted at two differenttemperatures.Basic sensor set: pH, pH/ORP, conductivity, and polarographic (Clarkcell) dissolved oxygen; compare Extended sensor set.Boxcar filtering: A smoothing scheme that looks at the 5 most recentdata points.Cable, see Comunication cable, Network cable, RuggedCable, <strong>TROLL</strong>Com, Vented cableCalibration: The process of determining the response of a measurementsystem to a known amount of the measured component inorder to permit the measurement of unknown samples.Calibration, out-of-box: Use of new Basic sensors for the MP <strong>TROLL</strong><strong>9500</strong> directly from the box, with factory-supplied calibration coefficients.Sensors should be calibrated after they are used and beginto drift.Calibration, Quick Cal: A rapid calibration procedure available for theBasic sensors, using a single solution.Calibration, traditional: Single- or multi-point methods for calibratingwater-quality sensors individually to gain higher accuracy.Calibration coefficients: Sensor slope and offset that convert analogmeasurements to user units; calculated during calibration.Calibration cup: Clear PVC vessel that attaches to the front end of theMP <strong>TROLL</strong> <strong>9500</strong> in place of the restrictor and holds the recommendedamount of calibration solution during calibration of thewater-quality sensors.Calibration kit: Boxed set of standards for calibrating a specific waterqualitysensor for operation in a specific range.Calibration solution, Calibration standard: A solution whose concentrationis accurately known.<strong>TROLL</strong> <strong>9500</strong> Operator’s <strong>Manual</strong> 1470095110 rev. 007 01/09
GlossaryCation: Positively charged ion (e.g., NH 4+, Na + ).Cell constant: A value that describes a conductivity cell which is determinedby electrode area and electrode separation.Chloride (Cl – ): Common anion in water that gives it a salty taste.Chlorophyll: Green pigment in plants that transforms light energy intochemical energy during photosynthesis.Clone: Copy all elements of a selected test definition to a new test.Combination electrode: A combination of a sensing or measurementelectrode and a reference electrode in one unit.COM port: RS232 serial communication port on a PC.Communication cable: see <strong>TROLL</strong> ComConductivity, electrical: A measure of the ability of an aqueous solutionto carry an electric current. Increases with increasing temperature.Connection node: Node in the Win-Situ or Pocket-Situ Navigationtree, representing the COM port on the host PC.Data folder: Node in the Win-Situ or Pocket-Situ Navigation tree,providing a view of tests that have been extracted from the devicememory to the host PC. The Data Folder can be expanded to showthe device type, device serial number, and test name.Data point: In logged data, one reading from every channel beingsampled.Density: Mass of a substance per unit volume (e.g., grams per liter,g/L; grams per cubic centimeter, g/cm 3 ). Water is most dense at 4°Celsius.Depth: The distance between the water surface and the pressure sensorof the MP <strong>TROLL</strong> <strong>9500</strong>. Converted from pressure units usingvalues selected by the user during pressure parameter setup.Derived measurement: Value calculated in software from the outputof more than one sensor; e.g., salinity is derived from conductivityand temperature.Device node: Node in the Win-Situ or Pocket-Situ Navigation tree,representing the connected MP <strong>TROLL</strong> <strong>9500</strong>.Digital DO: Proprietary method of powering the dissolved oxygen sensor;digital pulsing eliminates the need to stir the sample to avoidoxygen depletion.Dissolved oxygen (DO): The amount of oxygen present in water andavailable for respiration.DO: Dissolved Oxygen.Downhole cable, see RuggedCableDrift: Gradual change in sensor response with time.DSP: Digital signal processor.Electrode: An electric conductor through which an electric currententers or leaves a medium (such as an electrolyte).Electrolyte: A chemical compound which when dissolved in water willconduct an electric current; sensor filling solution.Event test, Event sampling: Test measurement schedule in which theselected parameters are measured at the same regular, unvaryinglinear interval, but the data are logged only if the measurementson the designated event channel exceed a user-specified value.Conserves storage memory while logging all meaningful data.Extended sensor set: Ammonium, chloride, nitrate, turbidity, and opticaldissolved oxygen sensors; compare Basic sensor set.Extract: Copy test data from the MP <strong>TROLL</strong> <strong>9500</strong> memory to a hostPC. Initiated by the Extract button when a test is selected in theNavigation tree.Firmware: Software program that resides in the memory of the MP<strong>TROLL</strong> <strong>9500</strong>; firmware can be field-upgraded.Flow cell: Clear vessel with input and output ports for routing flow pastthe sensors of the MP <strong>TROLL</strong> <strong>9500</strong>; alternative to in-situ installationof the instrument where in-place installation is not possible orpractical.Flow-Sense Wizard: Low-flow application in Win-Situ software formonitoring water-quality indicator parameters in a flow cell duringlow-flow pumping.FNU: Formazin Turbidity Units; compare NTUFS: Full scale.Gauged pressure sensor: Pressure sensor that is vented to theatmosphere; measures only pressure exerted by the water column,excludes the atmospheric pressure component. Compare Absolutepressure sensor; see also Vented cable.HDPE: High-density polyethylene.HIF: U.S. Geological Survey’s Hydrological Instrumentation Facility.Home site: Default site node (top node) in the Win-Situ or Pocket-SituNavigation tree, representing the host computer.<strong>TROLL</strong> <strong>9500</strong> Operator’s <strong>Manual</strong>148 0095110 rev. 007 01/09
GlossaryHost PC: Desktop computer running Win-Situ, or PDA running Pocket-Situ, connected to the MP <strong>TROLL</strong> <strong>9500</strong> via <strong>TROLL</strong> Com or othercommunication interface.Interference: The presence of a species in a sample other than thespecies being measured that causes erroneous values.Ionic strength: A measure of the total effect of all the ions, both positiveand negative, present in a solution.ISA (Ionic Strength Adjustor): Solution of high ionic strength which canbe added to both sample and calibration solutions in equal proportionsbefore measurement to minimize differences in ionic strength.ISE (Ion-Selective Electrode): An electrode which responds selectivelyto the ions of a particular species in solution.Isopotential point: The ion concentration at which changes in temperaturedo not cause a change in ISE sensor response (voltage).Isothermal: At constant temperature.Kcell, see Cell constantKCl: Potassium chloride.LED: Light-emitting diode, used in turbidity and Optical DO sensors.Level reference: User-specified starting point for level readings;entered during pressure parameter setup.Level—Surface: A mode for displaying logged pressure measurements;readings are positive up; useful for measuring surfacewater; permits use of zero or other user reference.Level—Top of Casing: A mode for displaying logged pressure measurements;readings are positive down, as the water level drawsdown from the top of the well casing; permits entry of zero or otheruser reference.Limnology: The science of the life and conditions for life in lakes,ponds, and streams.Linear average: Test measurement schedule in which each measurementstored to the data file is the average of multiple closelyspacedmeasurements.Linear test, Linear sampling: Test measurement schedule in which theselected parameters are measured at the same regular, unvaryingsample interval and all measurements are logged.Log test, Log sampling: Test measurement schedule in which measurementsbegin closely spaced and the interval between measurementscontinuously increases. Short for Logarithmic sampling.LSZH: Low smoke zero halideµM, µmol/L: micro Molar, unit of dissolved oxygen concentration; toconvert to mg/L, divide by 31.25.mg/L: Milligram per liter; equivalent to one part per million (ppm).mini<strong>TROLL</strong>: In-Situ’s 0.72” diameter downhole pressure/temperaturesmart probe.Molarity (M): A unit of measure indicating concentration in moles ofsolute per liter of solution.Multi-ISE: An ion-selective electrode that measures more than oneparameter.NaNO 3: Sodium nitrate.Na 2SO 3: Sodium sulfite.Navigation tree: Left side of the Win-Situ application interface, or topof the screen in Pocket-Situ, showing selectable nodes: Site, DataFolder, Connection, Device, Parameters, Tests.Nernst equation: The fundamental equation that relates the electrodepotential to the activity of measured ions in a solution.NH 4Cl: Ammonium chloride.N.I.S.T.: National Institute of Standards and Technology, a non-regulatoryfederal agency within the U.S. Department of Commerce.Formerly known as the National Bureau of Standards.Nitrate (NO 3–): Oxidized form of nitrogen that is highly soluble in water,present in soils, fertilizer, wastewater, etc.Node: Element in the Navigation tree on the left side of the Win-Situinterface, or at the top of the screen in Pocket-Situ. When a nodeis selected, the remainder of the screen displays details about thenode. Nodes include the Site, Data Folder, Connection, Device,Parameters (group node), single Parameter, Tests (group node),single Test.Non-vented pressure sensor, see Absolute pressure sensorNose cone: Detachable threaded protective stainless steel piece atthe front end of the MP <strong>TROLL</strong> <strong>9500</strong>.Nose cone stirrer, see StirrerNTU: Nephelometric turbidity unit, a measure of the intensity of lightscattered by a water sample. From nephelometer, a type of turbi-<strong>TROLL</strong> <strong>9500</strong> Operator’s <strong>Manual</strong>149 0095110 rev. 007 01/09
Glossarydimeter. Comparable to previously reported Formazin Turbidity Unit(FTU), and Jackson Turbidity Unit (JTU).Optode: optical electrode.ORP, see Oxidation-reduction potentialOxidation-reduction potential (ORP), also called “redox” potential(from “reducing” and “oxidizing”): Voltage difference at an inertelectrode immersed in a reversible oxidation-reduction system;measurement of the state of oxidation of the system.Parameter node: Node in the Win-Situ or Pocket-Situ Navigationtree, representing a single parameter (pressure, temperature, pH,conductivity, etc.).Parameters node: Node in the Win-Situ or Pocket-Situ Navigationtree, providing a view of all parameters the device can measure.Partial pressure: In a mixture of gases, the pressure a single gaswould exerted if it occupied the entire volume.Pascal: Unit of pressure equal to the pressure resulting from a force of1 newton acting uniformly over an area of 1 square meter.PC: Desktop or laptop computer.PDA (Personal Data Assistant): Generic term for a hand-held personalcomputer.pH: Term used to describe the hydrogen-ion activity of a system; thenegative logarithm of the activity of the hydrogen ions (H + ) in thesolution.Pocket PC: A type of PDA with an ARM processor and Pocket PC(Windows Mobile) operating system.Pocket-Situ: Win-Situ 4 software for supported PDAs.PocketSync for Pocket-Situ: Synchronization utility that runs on adesktop/laptop PC; automatically installs or updates Pocket-Situ ona connected PDA; synchronizes data and other files between thePDA and the PC where Win-Situ is installedPolarization: Application of a direct or alternating current to a sensor.Potassium chloride (KCl): A salt used to make conductivity calibrationstandards.ppm: Part-per-million; equivalent to a milligram per liter (mg/L).Precision: The closeness of agreement between independent testresults obtained under stipulated conditions. A measure of thereproducibility of a method.Pressure: A type of stress which is exerted uniformly in all directions.Its measure is the force exerted per unit area; e.g., pounds persquare inch (psi), newtons per square meter (pascals).Pressure transducer: Instrument or component that detects a fluidpressure and produces an electrical signal related to the pressure.Professional: MP <strong>TROLL</strong> <strong>9500</strong> model containing memory; able to logdata; accommodates the Basic sensor set.Professional XP: MP <strong>TROLL</strong> <strong>9500</strong> model with all features of theProfessional model and in addition allows use of the Extendedsensor set.Profiler: MP <strong>TROLL</strong> <strong>9500</strong> model without memory; must be used with aPC or PDA; accommodates the Basic sensor set.Profiler XP: MP <strong>TROLL</strong> <strong>9500</strong> model with features of the Profiler and inaddition allows use of the Extended sensor set.Profiling: Taking continuous real-time readings of all enabled parameters.PRT: Platinum resistance thermometer, a type of resistance temperaturedetector (RTD).psia: A pressure unit, pounds per square inch absolute, measured withrespect to zero pressure. All forces detected by the strain gaugeare measured, including atmospheric pressure.psig: A pressure unit, pounds per square inch gauge, measured withrespect to atmospheric pressure. Thus the atmospheric pressurecomponent is excluded.PSU: Practical Salinity Units, based on the Practical Salinity Scale.Pulsing: Periodic low-frequency polarization of a dissolved oxygensensor.Pump test, Pumping test: Aquifer characterization test that involvespumping out a known volume of fluid from a well and measuringthe time of recovery to stable conditions.Quick Cal: Rapid calibration procedure available for the MP <strong>TROLL</strong><strong>9500</strong> Basic sensors that uses a single solution.Quick Cal solution: A calibration standard of an appropriate chemicalcomposition to calibrate four parameters simultaneously (pH, ORP,Dissolved Oxygen, Conductivity).Quinhydrone: Dark green water-soluble compound, a 1:1 complexof benzoquinone and hydroquinone used as an ORP calibrationstandard when dissolved in pH buffer solution.<strong>TROLL</strong> <strong>9500</strong> Operator’s <strong>Manual</strong>150 0095110 rev. 007 01/09
GlossaryReading: Measurement from a single channel (parameter).Redox potential, see Oxidation-reduction potentialReference (water level measurements), see Level referenceReference electrode: A standard electrode of known potential againstwhich the measurement or sensing electrode is compared.Repeatability: Closeness of the agreement between the results of successivemeasurements carried out under the same conditions.Reproducibility: Closeness of the agreement between the results ofmeasurements of the same measurand carried out under nearlyidentical conditions but after an intermediate change was madeand removed.Resistance thermometer: Temperature sensor that changes electricalresistance with temperature.Resistivity: The reciprocal of conductivity; calculated from conductivity.Resolution: The smallest unit that can be measured by a device overits full range.Response time: Time required for the MP <strong>TROLL</strong> to power a sensorand the sensor to return an accurate reading.Restrictor: Perforated stainless steel area of the MP <strong>TROLL</strong> <strong>9500</strong>between the nose cone and the body; protects the sensors andallows free circulation of environmental fluid.RDO: Rugged optical dissolved oxygen sensorRS-485: Communications protocol using Recommended Standard485 of the Electronic Industries Association (EIA-485) for theorderly transfer of electrical data signals; a balanced (differential),multipoint Interface Standard that uses two lines to transmit/receivedata and can operate at 100 Kbps with cable lengths up to 4000feet.RTD: Resistance temperature detector, a type of resistance thermometerthat has nominally 100 Ω at 0°C.RuggedCable: Waterproof, submersible, TPU-jacketed ventedor non-vented cable for a Multi-Parameter <strong>TROLL</strong> <strong>9500</strong>; carriespower and communication signals; provides strain relief and ameans to anchor the instrument to a stationary object; Twist-Lockconnectors on both ends, Rugged (titanium) or Standard (carbonfilledABS plastic); halogen-free version available.S, see SiemensSalinity: A measure of the amount of salts dissovled in water, usuallyexpressed in parts per thousand (ppt); calculated from conductivityand temperature.Saturation: The point at which a substance contains a maximumamount of another substance at a given temperature and pressure.SC: Specific Conductance, conductivity corrected to 25°C.SDI-12: A serial-digital interface operating at 1200 baud.Sensor kit: Package containing an In-Situ sensor, along with necessaryinstallation items and instructions for installing in the Multi-Parameter<strong>TROLL</strong> <strong>9500</strong>.SI: International System of Units.Siemens (S): SI unit for conductivity, reciprocal of the ohm; this unitwas formerly known as the “mho” (ohm spelled backwards).Site node: Topmost node in the Win-Situ or Pocket-Situ Navigationtree, representing the host computer.Slope: Sensor response vs. concentration (quantity). Slope and offsetare the coefficients calculated during calibration that convert analogmeasurements to user units.Slug test: Aquifer characterization test that involves “slugging” a wellwith a known volume of fluid or solid and measuring the time ofrecovery to stable conditions.Soak time: Length of time a sensor is immersed in a calibration solutionor sample, ideally at the same temperature at which measurementswill be taken.Sodium nitrate (NaNO 3): A salt used to make nitrate calibration standards.Specific conductance: Conductivity of a solution at 25°C.Standard Methods: Approved methods of analyzing for water-qualityparameters, as specified in the reference work Standard Methodsfor the Examination of Water and Wastewater, published jointly bythe American Public Health Association, American Water WorksAssociation, and Water Environment Federation.Stirrer: Battery-powered motorized low-power stirring mechanism withmagnetic stirring bar for use during calibration and/or in stagnantwaters.Submersible cable: Waterproof, quick-connect cable designed for submersion;Instrument backshell located at downhole end; surfaceconnector at surface end.<strong>TROLL</strong> <strong>9500</strong> Operator’s <strong>Manual</strong>151 0095110 rev. 007 01/09
GlossarySurface connector: Multi-function vented nylon connector at the surfaceend of the MP <strong>TROLL</strong>’s submersible cable; accommodates avariety of top-of-well devices for communications, networking, andpower supply.TDS, see Total Dissolved SolidsTefzel ® : Dupont ® ’s modified ETFE fluoropolymerTemperature, Solution temperature: Amount of heat present in thesolution in which the instrument is submerged.Test: Instructions to the MP <strong>TROLL</strong>’s internal logger for collectingdata; the logged data from one set of instructions.Test node: Node in the Win-Situ or Pocket-Situ Navigation tree, representinga single test.Tests node: Node in the Win-Situ or Pocket-Situ Navigation tree,providing a view of all tests currently stored in the device memory.TOC (Top of Casing), see Level—Top of CasingTorr: A unit of pressure, equal to 1/760 atmosphere.Total Dissolved Solids (TDS): The amount of dissolved substances,such as salts or minerals, in water remaining after evaporating thewater and weighing the residue. Calculated from conductivity.<strong>TROLL</strong> Com: Communication cable interface between MP <strong>TROLL</strong><strong>9500</strong> and a desktop/laptop PC or RuggedReader handheld PDA.Turbidity: A measure of the transparency of water.Twist-Lock Hanger: Back end hanger without venting or communicationcapabilities; allows use of inexpensive hanging cable whiletaking absolute (non-vented) pressure data with a preprogrammedinstrument.Units: Measurement units; user-selectable in software interface.Vented cable: RuggedCable with a vent tube that applies reference atmosphericpressure to the back of the pressure sensor diaphragm.Vented pressure sensor, see Gauged pressure sensorVertical profile: Characterization of a water column from surface tobottom (or vice-versa) through multiple real-time readings of thewater-quality parameters of interest taken at varying depths.Win-Situ 4: Instrument control software for instrument setup, calibration,profiling, data logging, data retrieval and display.ZoBell’s: A redox standard solution with a known state of oxidation-reductionpotential (measured in milliVolts) used to calibrate ORP.TPU: Thermoplastic Polyurethane, a cable jacket option.<strong>TROLL</strong> <strong>9500</strong> Operator’s <strong>Manual</strong>152 0095110 rev. 007 01/09
Multi-ParameterWater Quality <strong>TROLL</strong> ®IndexAABEND, 37, 39, 143Accessories, 8–9Accuracy specifications, 10–11electronic drift, 145ActiveSync, 9, 14, 30, 42, 136Add... buttonadd connection, 24add test, 29, 35Altitude. See ElevationAmmoniapH and, 66, 104Ammoniumabout, 104calibration, 105–108interferences, 108pH and, 66, 104Ammonium sensor, 104–105cleaning, 109hydrating, 104installing, 105slope & offset, 108storage, 109Aquifer testing, 46Atmospheric pressure. See Barometric pressureBBarometric pressure, 56compensating pressure readings for, 47, 52in dissolved oxygen measurements, 36, 86sensor, 56units, 56vs. elevation (table), 57without vented cable, 56Baro <strong>TROLL</strong>, 52Baro Wizard, 52–53Basic Sensor Set, 58Batteries, 7displaying capacity, 25installing, 12replacing, 141setting battery type, 26Baud rate, 16CCable, 6communication cables, 7field installation, 51non-vented cable, 56–57suspension wire, 6, 51<strong>TROLL</strong> Com, 7, 14vented cable, 47Calibration, 28, 60–65ammonium, 105–108chloride, 111–114conductivity, 73–76dissolved oxygen, optical (RDO), 91–94dissolved oxygen, polarographic, 80–84frequency, 64history, 63–64kits, 61nitrate, 116–118nominal stability, 18, 60ORP, 98–100overview, 28, 60–61pH, 67–70pressure, 46, 145Quick, 17–20reports, 63–64transferring to desktop PC, 42resetting defaults, 61rinsing, 62stability, 60stirring, 62temperature and, 55, 62traditional, 60turbidity, 124–128Calibration cup, 61, 144Cancel a test, 41Cell constant, 61, 72, 73entering manually, 76Chlorideabout, 110calibration, 111interferences, 114Chloride sensor, 110cleaning, 114hydrating, 110installing, 110slope & offset, 114storage, 114Clark D.O. sensor. See Dissolved oxygen sensor,polarographic<strong>TROLL</strong> <strong>9500</strong> Operator’s <strong>Manual</strong> 1530095110 rev. 007 01/09
IndexCleaning, 4, 142ammonium sensor, 109chloride sensor, 114conductivity sensor, 77dissolved oxygen sensor, optical (RDO), 96dissolved oxygen sensor, polarographic, 87nitrate sensor, 120pH/ORP sensor, 101pH sensor, 71turbidity sensor, 128–129Clocksetting, 26Clone button, 39, 41Communication cables, 7Communication errors, 16, 143COM port, 14, 16Conductivityabout, 72and temperature, 77calibration, 73Quick Cal, 74units, 76Conductivity sensor, 72cell constant, 61, 73, 75, 76installing, 73maintenance, 77storage, 77Connection type, 16Connection Wizard, 16, 24Continuous button (Profiler), 34Customer service, 3DData files, 40. See also Testslocation, 40name, 40saving as text files, 45transferring from PDA, 42Data folder, 23, 34, 40, 42viewing data in, 43–44Date & timeadding to graph, 44setting device clock, 26Decontamination guidelines, 4Default storage (event test), 38Delete buttondelete connection, 24delete test, 41Delta (event test), 37Density. See Liquid densityDepth, measuring, 47, 48, 50Depth rating, sensors, 51, 65Derived measurementsfrom conductivity, 76–77from dissolved oxygen, 85Desiccant, 7Device information, 24–25Device node, 23Display units, 27Dissolved oxygenabout, 78calibration, optical (RDO), 91–95calibration, polarographic, 80–85percent saturation, 85, 95profiling, 32Quick Cal, 17units, 85Dissolved oxygen sensor, optical (RDO), 89and flowcell, 135barometric pressure compensation, 36cleaning, 96comparison to polarographic, 89–91displaying in Profiler, 32installing, 89–91salinity compensation, 36, 89–91Dissolved oxygen sensor, polarographic, 79–80barometric pressure compensation, 36cleaning, 87conditioning, 17, 79, 80filling, 79installing, 79slope & offset, 85storage, 87DO. See Dissolved oxygenDon’t Ask dialogs, 27Downloading data. See Extracting dataDrift, electronic, 145EEdit... buttonedit barometric pressure, 56edit connection, 24edit device, 26edit pressure, 28, 48–49edit test, 39Electrical conductivity. See ConductivityElevationin pressure to level conversion, 49vs. pressure (table), 57Eutrophication, 78Event test, 36, 37–38Excelcustom low-flow template, 139exporting data to, 45exporting low-flow data to, 139Expand devices on find, 27Extended Sensor Set, 59Extract button, 40Extracting data, 30, 40FFeatures upgrade, 25Find button, 24expand devices on Find option, 27Firmware upgrade, 3, 25Flow-Sense Wizardcreating templates, 136entering target values, 138measurement interval, 138output files, 139preparation, 135reports, 139<strong>TROLL</strong> <strong>9500</strong> Operator’s <strong>Manual</strong> 1540095110 rev. 007 01/09
Indexsaving data, 138setting unit preferences, 136starting from a file or template, 136starting from Navigation tree, 136starting from Tools menu, 136total volume, 137Fluid density. See Liquid densityFormazin, 125GGraphing controlsPocket-Situ, 45Win-Situ, 44Graphing data, 44Profiler data, 32Gravitational accelerationin pressure to level conversion, 49HHome site, 23IInformation pane, 23Installationaccessories for, 9cable grip, 51sensors, 59LLevel, measuring, 47, 50Surface mode, 48Top of Casing mode, 48Level reference, 49Linear average test, 37, 38Linear test, 36, 37Liquid density, 49calculating, 145in pressure to level conversion, 49Logging data, 35–41. See also Testsoverview, 29Low-flow monitoring, 135–139with RDO sensor, 135Low-flow software. See Flow-Sense WizardMMaintenance & calibration service, 3, 53<strong>Manual</strong> start mode, 37Measurement units, 27Microsoft ActiveSync, 9, 14, 30, 42Microsoft Excel, 45, 139NNameconnection, 16data files, 34, 40pressure channel, 48test, 36Navigation tree, 23test status symbols in, 39Nernst equation, 66, 97Nitrateabout, 115calibration, 116interferences, 120Nitrate sensor, 115cleaning, 120hydrating, 116installing, 116slope & offset, 119storage, 120Nominal stability, 18, 60Nose cone, 6OOptical D.O. sensor. See Dissolved oxygen sensor,optical (RDO)O-rings, 141ORPsensor, 60about, 97calibration, 98Quick Cal, 17sensor offset, 100units, 100–101ORP sensor. See pH/ORP sensorPParameter Wizard, 48PDAtransferring data to desktop PC, 42pHabout, 66calibration, 67in low ionic strength samples, 71Quick Cal, 17, 68pH/ORP sensor, 97calibration, 68, 99installing, 67, 98maintenance, 101resetting default coefficients, 70, 100storage, 101pH sensor, 66installing, 67maintenance, 71resetting default coefficients, 70slope & offset, 70storage, 70, 71usage, 70Pocket-Situabout, 9, 22activating, 22installing, 14interface, 23system requirements, 9Powerexternal, 7, 25internal, 7Practical Salinity Scale, 77Preferences, 27Pressureconversion to depth or level, 49measuring, 46, 47Pressure head mode, 48<strong>TROLL</strong> <strong>9500</strong> Operator’s <strong>Manual</strong> 1550095110 rev. 007 01/09
IndexPressure rating, sensors, 51, 65Pressure sensorabout, 46–47absolute vs. gauged, 47factory calibration, 46field recalibration, 47non-vented vs. vented, 47recalibration, 53zeroing, 47Pressure setup, 48–50summary, 50Product specifications, 10–11Profiling, 31–34changing channels displayed, 32, 33, 34changing measurement units, 34changing sample rate, 27, 34depth or level, 32dissolved oxygen, 32exiting the Profiler, 34graphing data, 32logging data, 34retrieving data, 34starting software in Profiler mode, 27, 34starting the Profiler, 31turbidity, 32, 128PSIA, 47PSIG, 47Pumping tests, 46QQuick Cal, 17–20, 28, 61Rsensors that cannot use, 20with RDO sensor installed, 17, 96RDO sensor. See Dissolved oxygen sensor,optical (RDO)Real-time readings. See ProfilingRefresh button, 24, 25Removing sensors, 60Repair service, 3Resistivity, 77Restrictor, 6RMA, 3RuggedReader, 9, 14SSalinity, 77and RDO sensor, 36, 89Scheduled start mode, 37SDI-12, 130–134adapter, 130commands, 131, 133enable/disable, 26, 130out-of-range readings, 132wiring, 130Sealso-rings, 141sensor o-rings, 60Sensors, 58ammonium, 104barometric pressure, 56chloride, 110conductivity, 72dissolved oxygen, optical (RDO), 89installing, 13nitrate, 115o-rings, 60pH, 66pH/ORP, 97pressure, 46removing, 60replacement, 65serial number, 2, 65specifications, 10storage, 63temperature, 54turbidity, 122Serial number, 2Settings options, 27Show Calibration Report button, 64Slug tests, 46Snapshot button (Profiler), 34Software, 9. See also Win-Situ, Pocket-SituSoftware upgrade, 3Specifications, 10–11Specific conductance, 76Specific gravity, 49Stirrer, 62, 65Stirringand polarographic D.O. measurement, 86–88during calibration, 62Surface mode, 48TTechnical support, 3Temperatureabout, 54and calibration, 55, 62units, 55Temperature sensor, 54Test name, 36Tests, 35adding to device, 21, 35cancelling, 41cloning, 41deleting, 30, 41event, 36, 37extracting, 40linear, 36, 37linear average, 37, 38manual start mode, 37measurement interval, 37measurement schedules, 36printing, 45saving as text files, 45scheduled start mode, 37setting up, 35starting, 40status symbols in Navigation tree, 39stopping, 37, 40viewing, 30, 43Test setup, 35<strong>TROLL</strong> <strong>9500</strong> Operator’s <strong>Manual</strong> 1560095110 rev. 007 01/09
IndexTest Wizard, 35Text files, 45Top of Casing mode, 48Total Dissolved Solids, 77<strong>TROLL</strong> Com, 7, 14USB drivers for, 14Turbidityabout, 121–122calibration, 124–128calibration standards, 124profiling, 32, 128Turbidity sensor, 122cleaning, 128–129resetting default coefficients, 128Turbidity wiper, 122–124during Quick Cal, 17installation, 123maintenance, 129“manual” wipe, 124Twist-Lock connectors, 15Twist-Lock hanger, 9, 51firmware, 3, 25software, 3Uploading data. See Extracting dataUser reference. See Level referenceVVented cable, 47Viewing data, 30, 43WWarranty provisions, 3Water level. See Level, measuringWin-Situabout, 9, 22exiting, 30installing, 14interface, 23launching, 22system requirements, 9Win-Situ Software Manager, 14Win-Situ Sync, 14, 42UUnits, selecting, 27Upgradingfeatures, 25<strong>TROLL</strong> <strong>9500</strong> Operator’s <strong>Manual</strong> 1570095110 rev. 007 01/09
221 East Lincoln Avenue • Ft. Collins, Co. 80524 USATel: 970.498.1500 • 800.446.7488 • Fax: 970.498.1598Declaration of ConformityManufacturer:In-Situ, Inc.221 East Lincoln AvenueFt. Collins, Co. 80524USADeclares that the following product:Product name: Multi-Parameter <strong>TROLL</strong> <strong>9500</strong>Model:WQP-100Product Description: The Multi-Parameter Troll <strong>9500</strong> provides real-time readings for and logs up to 9 waterleveland water-quality parameters 7 of which are multi-configurable in addition to thebuilt-in temperature and barometric pressure parameters.is in compliance with the following Directive89/336/EEC for Electromagnetic Compatibility (EMC)and meets or exceeds the following international requirements and compliance standards:• ImmunityEN 61326:1997, Electric <strong>Equipment</strong> for Measurement, Control and Laboratory Use• EmissionsClass A requirements of EN 61326:1997, Electric <strong>Equipment</strong> for Measurement, Control andLaboratory UseSupplementary Information:The device complies with the requirements of the EU Directive 89/336/EEC, and the CE mark is affixedaccordingly.Todd CampbellNew Product Development Program ManagerIn-Situ, Inc.October 28, 2005
Declaration of ConformityManufacturer:In-Situ, Inc.221 East Lincoln AvenueFort Collins, CO 80524USADeclares that the following product:Product name:Model:Product Description:<strong>TROLL</strong> ComUSB <strong>TROLL</strong> ComRS485 to USB converteris in compliance with the following Directive89/336/EEC for Electromagnetic Compatibility (EMC) Directive73/23/EEC for Safety Directiveand meets or exceeds the following international requirements and compliance standards:• ImmunityEN 61326, Electrical <strong>Equipment</strong> for Measurement, Control and Laboratory Use, IndustrialLocation• EmissionsClass A requirements of EN 61326, Electrical <strong>Equipment</strong> for Measurement, Control andLaboratory UseSupplementary Information:The device complies with the requirements of the EU Directives 89/336/EEC and 73/23/EEC, and the CEmark is affixed accordingly.Todd CampbellNew Product Development Program ManagerIn-Situ, Inc.June 17, 2006