- Page 14:
Preface xvAcknowledgmentsForeword x
- Page 18:
Chapter 9: Fluoroscopy 2319.1 Funct
- Page 22:
16.3 Transducers 48316.4 Beam Prope
- Page 26:
B.3 Radiological Data for Elements
- Page 32:
We are deeply grateful to that part
- Page 38:
Can medical physics be interesting
- Page 46:
INTRODUCTION TO MEDICALIMAGINGMedic
- Page 50:
FIGURE 1-2. The chest x-ray is them
- Page 54:
FIGURE 1-4. A computed tomography (
- Page 58:
angles around the patient. These pr
- Page 62:
FIGURE '-8. Sagittal (upper left),
- Page 66:
ducer, which records the returning
- Page 70:
TABLE 1-1. THE LIMITING SPATIAL RES
- Page 76:
WAVELENGTH(nanometers)FREQUENCY(her
- Page 80:
The physical properties of the most
- Page 84:
The energy required to remove an el
- Page 88:
An electron cascade does not always
- Page 92:
160150140130120110100N
- Page 96:
The binding energy can be calculate
- Page 102:
INTERACTION OF RADIATIONWITH MATTER
- Page 106:
x10 3 7becomes electrically neutral
- Page 110:
Electrons can undergo inelastic int
- Page 114:
The nuclide produced by neutron abs
- Page 118:
Compton scattering results in the i
- Page 122:
CharacteristicX-rays:A: 0.6 keV (N~
- Page 126:
10030 \~ r.." Photoelectric Effect
- Page 130:
Attenuation is the removal of photo
- Page 134:
The relationship between material d
- Page 138:
HVL). Most practical applications o
- Page 142:
MFP = 1- = __ 1__ = 1.44 HVLI.l 0.6
- Page 146:
For x- and gamma rays, kerma can be
- Page 150:
1 R = 2.58 X 10- 4 C/kg (exactly)Ra
- Page 154:
TABLE 3-4. RADIATION WEIGHTING FACT
- Page 158:
TABLE 3-6. RADIOLOGICAL QUANTITIES,
- Page 162:
Computers were originally designed
- Page 166:
TABLE 4-2. CONVERSION OF 42 (DECIMA
- Page 170:
Binary Representationof Signed Inte
- Page 174:
Chapter 4: Computers in Medical Ima
- Page 178:
TABLE 4-5. MAXIMAL ERRORS WHEN DIFF
- Page 182:
Main memory is used for these funct
- Page 186:
A CPU fetches and executes the inst
- Page 190:
FIGURE 4-6. Hard-disk drive. Aread/
- Page 194:
Table 4-6 compares the characterist
- Page 198:
erwise identical, the computer with
- Page 202:
function, such as a disk head crash
- Page 206:
Scintillation camera planarSPECTPET
- Page 210:
(1.4 MB/disk)(l,024 2 bytes/MB)/[(6
- Page 214:
DAC converts each digital number to
- Page 218:
UnpolarizedlightHorizontallypolariz
- Page 222:
FIGURE 4-15. Graphs of four transla
- Page 226:
For example, it is often useful to
- Page 234:
X-RAY PRODUCTION, X-RAYTUBES, AND G
- Page 238:
1 _2 -3-1Impact with nucleus:Maximu
- Page 242:
FIGURE 5-4. Generation of a charact
- Page 246:
Cable sockets ~FIGURE 5-6. The majo
- Page 250:
~C1.61.41.2 _~ 1.0::l0 0.8Q).00.62-
- Page 254:
Rotor~~ ~+-statorFIGURE 5-11. The a
- Page 258:
There are three major tradeoffs to
- Page 262:
FIGURE 5-16. Various tools allow me
- Page 266:
5.3 X-RAY TUBE INSERT, TUBE HOUSING
- Page 270:
TABLE 5-3. MINIMUM HALF VALUE LAYER
- Page 274:
Induced electronflow in conductorRe
- Page 278:
Power is the rate of energy product
- Page 282:
used to modulate voltage, autotrans
- Page 286:
mAand mAscontrolPhototimercircuitsF
- Page 290:
(a)Electron flow through single rec
- Page 294:
asic components of a single-phase t
- Page 298:
In three-phase generator designs, h
- Page 302:
greater overall input power). Next,
- Page 306:
nected to the contactors that dose
- Page 310:
600500~5 4001:~•..=:l()300Q).0=:l
- Page 314:
100% Ripple \5% Ripple /\ ••.-
- Page 318:
TABLE 5-6. X-RAY TUBE FOCAL SPOTSIZ
- Page 322:
Chapter 5: X-Ray Production, X-Ray
- Page 326:
of the chart. Like the single-expos
- Page 330:
Projection radiography, the first r
- Page 334:
IEi\\i~eFIGURE 6-2. The sides andhe
- Page 338:
sure on the screens, the cassette m
- Page 342:
version efficiency, the approximate
- Page 346:
(and vice versa). This phenomenon i
- Page 350:
~80o"-'"{)' 70c.~ 60lij 50c.240 .
- Page 354:
film OD. If the screen is made thic
- Page 358:
Film has excellent spatial resoluti
- Page 362:
-(/l~ 2.0-c:8 1.51.0-(/l~ 2.0-c:8 1
- Page 366:
educed latitude. The shaded region
- Page 370:
TABLE 6-2. TISSUE HALF-VALUELAYERS
- Page 374:
PrimaryScatterFIGURE 6-22. A: Scatt
- Page 378:
ferent locations from within the pa
- Page 382:
lar to the direction of the slits.
- Page 386:
FIGURE 6-30. Air gap geometry canre
- Page 392:
silver halidecrystalssensitivityspe
- Page 396:
•FIGURE 7-3. The fate of an expos
- Page 400:
DeveloperActivatorRestrainerPreserv
- Page 404:
increased too much because the numb
- Page 408:
can be achieved. Film manufacturers
- Page 412:
Modern x-ray equipment is computer
- Page 416:
wee en0.25Ol0U. 0.20+Q)(f) 0.15COCO
- Page 422:
Mammography is a radiographic exami
- Page 426:
Other modalities that have been use
- Page 430:
plished by magnetic induction. A so
- Page 434:
ReferenceAxisCentra0AxisProjectedfo
- Page 438:
30 kVp26 kVp30 kVp26 kVp(b)2.01.81.
- Page 442:
OJE 25.E(fl.9 20o~ 15"'___ to 45 x
- Page 446:
TABLE 8-2. REQUIREMENTS FOR MINIMUM
- Page 450:
TerminationCircuitFIGURE 8-15. The
- Page 454:
simulations and experimental measur
- Page 458:
1.21.11.00.90.80.70.60.50.40.30.20.
- Page 462:
2!£.= 1.85 xSODSOD35cmSID65cmOlD30
- Page 466:
Film BaseFilm EmulsionPhosphor Scre
- Page 470:
equiring a compensatory increase in
- Page 474:
0.25 -Base + Fog0.20Density 0.150.1
- Page 478:
characteristic curves, the correspo
- Page 482:
achieving a pixel size at the image
- Page 486:
Chapter 8: Mammography 223TABLE 8-6
- Page 490:
ifies that the mammography facility
- Page 494:
TABLE 8-9. SUMMARY TABLE OF ANNUAL
- Page 498:
preting radiologists, mammography t
- Page 504:
with the fluoroscopy imaging chain
- Page 508:
FIGURE 9-4. A scanningelectron micr
- Page 512:
cm 2 area of the 9-inch-diameter in
- Page 516:
_ 100~I 20 em patient ~~•.... _~-
- Page 520:
Video CamerasGeneral OperationThe c
- Page 524:
FIGURE 9-11. The flat panelimaging
- Page 528:
higher. Cine radiography uses very
- Page 532:
put, and consequently frame averagi
- Page 536:
contrast" selections on the console
- Page 540:
specific applications, such as GIIG
- Page 544:
3'2'E~wtJ)w 0.3~,======_o~"~~--;~ _
- Page 548:
time estimate of the amount of radi
- Page 552:
.~! ~i !j t--------------Ij• •s
- Page 556:
'E 2O . O 80(,)~ 100_70-~0CIlIIIr::
- Page 560:
40003500CIl 3000::s~ 2500CIlB 2000U
- Page 564:
can be radically changed. Therefore
- Page 568:
FIGURE 10-10. A: An isometric displ
- Page 572:
FIGURE 10-13. Some physical mechani
- Page 576:
some clinical applications, the blu
- Page 580:
would correspond to 1 cycle/mm. If
- Page 584:
I;:' 0.6irI-:!: 0.41.0 2.0 3.0 4.0S
- Page 588:
or stochastic component into the im
- Page 592:
~~2IIIs:::I I>o40 60 80 100 120 140
- Page 596:
The term quantum is defined as "som
- Page 600:
Stage Description System P System Q
- Page 604:
.g tides:eis.Ec(~ co~o o 2 4 6 8 10
- Page 608:
detectorelements[-I I detector aper
- Page 612:
Since most patient anatomy does not
- Page 616:
detail curves are commonly used in
- Page 620:
actually calls nor-The specificity
- Page 626:
Digital radiographic image receptor
- Page 630:
-8 0.8:J:=~0.6«g! 0.4:;:;ellGi0::
- Page 634:
to a very bright light source, whic
- Page 638:
Lens Coupled Intensifying ScreenFIG
- Page 642:
discretedetectorelementsFIGURE 11-7
- Page 646:
light sensitive areaFill Factor = a
- Page 650:
for digital stereotactic biopsy. Br
- Page 654:
Because the slot width (4 mm) is mu
- Page 658:
One of the advantages of having an
- Page 662:
ness. Windowing and leveling of a d
- Page 666:
nel is called a delta function,anyw
- Page 670:
pixels are averaged to go from a 51
- Page 674:
Geometric tomography, also called b
- Page 678:
ground anatomy causes geometric tom
- Page 682:
of relatively rapid readout, allowi
- Page 686:
system, the amount of vascular sten
- Page 690:
dual-energy subtraction is availabl
- Page 696:
point on the image. Consequently, w
- Page 700:
FIGURE 13-3. Computedtomographic (C
- Page 704:
FIGURE 13-5. First-generation (rota
- Page 708:
FIGURE 13-7. Third-generation (rota
- Page 712:
FIGURE 13-10. The fan beam geometry
- Page 716:
helical x-ray tubepath around patie
- Page 720:
septa that separate the individual
- Page 724:
detector array modules. With a trad
- Page 728:
Slice Thickness: MultipleDetector A
- Page 732:
This implies that the upper limit o
- Page 736:
FIGURE 13-22. An image of a test ob
- Page 740:
The constant ~t factors out, result
- Page 744:
6 8A+B=77 A+C=6A+D=57 B+C=9B+D=8C+D
- Page 748:
simple backprojection, p(x) is back
- Page 752:
The units for the x-axis in Fig. 13
- Page 756:
msec is preprocessed, mathematicall
- Page 760:
FIGURE 13-33. The coronal, sagittal
- Page 764:
ware through the volume data set, f
- Page 768:
of CT slices. The MSAD could be mea
- Page 772:
position along torsoFIGURE 13-37. D
- Page 776:
Factors AffectingSpatial Resolution
- Page 780:
x-ray beam hardeningFIGURE 13-38. T
- Page 784:
FIGURE 13-41. A partialvolume artif
- Page 788:
motion of the electrons in either a
- Page 792:
Biologically relevant elements that
- Page 796:
FIGURE 14-4. A: A single proton pre
- Page 800:
FIGURE 14-5. A: The laboratory fram
- Page 804:
magnetic field are separated by an
- Page 808:
8 1 at Larmor FrequencyzMot:/81....
- Page 812:
The "decay" of the FID envelope is
- Page 816:
method to determine the T1 time of
- Page 820:
50 msec). Molecular motion, size, a
- Page 824:
TEI'I180 0 EchoRotatingframe./FID s
- Page 828:
--_. unsaturatedpartiallysaturated:
- Page 832:
the figure on the left (longitudina
- Page 836:
Imageintensit)GrayWhiteFat1000 2000
- Page 840:
TRTERFpulses90 0readout~~~~~~--n~18
- Page 844:
Transverse decay (T2)Imageintensit~
- Page 848:
Rotating frame../FIGURE 14-29. Grad
- Page 852:
very shortTR. In these two regimes,
- Page 856:
FIGURE 14-32. A spoiled transverse
- Page 860:
acquired. Because the BOLD sequence
- Page 864:
412 Section II: Diagnostic Radiolog
- Page 870:
MAGNETIC RESONANCE IMAGING(MRI)The
- Page 874:
Net gradient = ~G 2 + G 2 + G 2x Y
- Page 878:
strength, an applied RF pulse with
- Page 882:
FIGURE 15-7. The width of the sinc
- Page 886:
1•1 cycle/em :1::UAmplitude: 1.0~
- Page 890:
positionally dependent phase shift
- Page 894:
xImage (grayscalevalue)FIGURE 15-14
- Page 898:
8. The final image is a spatial rep
- Page 902:
~.......--, ----J+*-.J4~====~_~~.\-
- Page 906:
FEG n n n IL.-ct--Echo ,I.16 ms 32
- Page 910:
ing time is approximately equal to
- Page 914:
sition of the signals (Fig. 15-24),
- Page 918:
this is unacceptable for standard c
- Page 922:
FIGURE 15-27. Evolution of a narrow
- Page 926:
Unsaturated spins: high signalFlow-
- Page 930:
volume and places this value in the
- Page 934:
In MRI, artifacts manifest as posit
- Page 938:
·······i..··I·I~IdealFIGU
- Page 942:
FIGURE 15-33. A single bad pixel in
- Page 946:
On Tl-weighted images of the head,
- Page 950:
A higher frequency encode gradient
- Page 954:
c:~...:L~"'FOii·"·"""~·~- ~; t--
- Page 958:
purely resistive system is the abil
- Page 962:
RF coils create the B 1 field that
- Page 966:
86~~ c:~"0~"0m0::214Axial distance
- Page 970:
15-2. Qualitative and quantitative
- Page 974:
RF exposure causes heating of tissu
- Page 980:
Transducer/ ArrayInterrogate bodywi
- Page 984:
and its resistance to being com-ulu
- Page 988:
are determined by the imaging appli
- Page 992:
TABLE 16-2. DECIBEL VALUES. INTENSI
- Page 996:
ZI = PICI~~IncidentReflection(echo)
- Page 1000:
When C2 > Cl, the angle of transmis
- Page 1004:
Penetrationdepth, cm(Distance trave
- Page 1008:
Plastic CaseMetal shieldAcoustic ab
- Page 1012:
~ ----+thicktransducer~ ----+thintr
- Page 1016:
intermediate to those of soft tissu
- Page 1020:
Linear ArraysLinear array transduce
- Page 1024:
sound beam path is thus largely con
- Page 1028:
phase differences of adjacent beams
- Page 1032:
III ¢ __ Red;e'vane';ons-~Thicknes
- Page 1036:
FIGURE 16-22. Axial resolution iseq
- Page 1040:
One way to accomplish this is to ac
- Page 1044:
Ultrasound equipment is rapidly evo
- Page 1048:
TABLE 16-6. TYPICAL PRF, PRp, AND D
- Page 1052:
(3) Demodulation and"Envelope" dete
- Page 1056:
systems, and digitally in high-end
- Page 1060:
drifted easily and were unstable ov
- Page 1064:
State-of-the-art ultrasound scanner
- Page 1068:
Image Frame Rate and Spatial Sampli
- Page 1072:
els of gray scale. Image storage (w
- Page 1076:
Based on the harmonic imaging work
- Page 1080:
FIGURE 16-40. Conventional (left) a
- Page 1084:
exactly phase reversed, and their s
- Page 1088:
FIGURE 16-43. Three-dimensional ult
- Page 1092:
occasionally induced by environment
- Page 1096:
LiverBoundarydisplacementFIGURE 16-
- Page 1100:
Blood moving towards transducerprod
- Page 1104:
The continuous-wave Doppler system
- Page 1108:
DopplerSignalLow frequencyDoppler s
- Page 1112:
eam is aligned at a particular orie
- Page 1116:
information is displayed on the vid
- Page 1120:
Transducerarray &BeamFormerPulse-ec
- Page 1124:
FIGURE 16-54. A comparison of color
- Page 1128:
c024VerticalbandE 60..c8-0..(])0 10
- Page 1132:
TABLE 16-8. RECOMMENDED QC TESTS FO
- Page 1136:
In the pulsed mode of ultrasound op
- Page 1140:
ecommends adherence to the ALARA pr
- Page 1146:
COMPUTER NETWORKS, PACS,AND TELERAD
- Page 1150:
tions protocols. Failure to conform
- Page 1154:
The most common LAN medium is Ether
- Page 1158:
nodes are both on the same segment
- Page 1162:
physics/text will obtain, from a se
- Page 1166:
can be programmed to read the traff
- Page 1170:
CT North EJCT04_MRG1-:::S:::(Toshib
- Page 1174:
a laser and the other using a colli
- Page 1178:
(14 x 17 inch) film should be digit
- Page 1182:
equipped with specialized software
- Page 1186:
The storage may be centralized (i.e
- Page 1190:
FIGURE 17-10. Interpretationworksta
- Page 1194:
Spatial linearity (freedom from spa
- Page 1198:
the faces of the monitors, and to a
- Page 1202:
Disadvantagesof PACS1. Initial and
- Page 1206:
ital portions of the system can deg
- Page 1214:
RADIOACTIVITY AND NUCLEARTRANSFORMA
- Page 1218:
TABLE 18-3. PHYSICAL HALF-LIFE (Tp1
- Page 1222:
A plot on a lineat axis of activity
- Page 1226:
Although the ~- particles emitted b
- Page 1230:
The capture of an orbital electron
- Page 1234:
RADON-220Alpha DecayT 1/2 = 55 seco
- Page 1238:
TECHNETIUM 99MIsomeric TransitionT1
- Page 1242:
RADIONUCLIDE PRODUCTION ANDRADIOPHA
- Page 1246:
continue to acquire kinetic energy,
- Page 1250:
come the nuclear binding forces. Th
- Page 1254:
duced), the reactor is said to be s
- Page 1258:
chemically separated from other fis
- Page 1262:
FIGURE 19-7. Picture of a "wet" mol
- Page 1266:
een achieved, the daughter activity
- Page 1270:
feres with the preparation of some
- Page 1274:
high abundance (94%), their low ene
- Page 1278:
Cell SequestrationRBCs are withdraw
- Page 1282:
ReceptorBindingThis class of radiop
- Page 1286:
closure of alternative treatments;
- Page 1290:
RADIATION DETECTION ANDMEASUREMENTT
- Page 1294:
Q)•..III•..a:c~010,000800060004
- Page 1298:
This equation can be written as fol
- Page 1302:
LimitedGeiger-MuellerRegionProporti
- Page 1306:
Unlike ion chambers, which can func
- Page 1310:
as well. However, most photodiodes
- Page 1314:
Chapter 20: Radiation Detection and
- Page 1318:
tional to the intensity of the ligh
- Page 1322:
"=@ @=@=II "II II II=@-@=@=II II II
- Page 1326:
tional to the energies deposited in
- Page 1330:
changing the voltage produced by th
- Page 1334:
X-Ray and Gamma-Ray Spectroscopy wi
- Page 1338:
gamma rays deposit exactly the same
- Page 1342:
trum on the left shows a large phot
- Page 1346:
FIGURE 20-23. Thyroid probe system.
- Page 1350:
FIGURE 20-26. Automatic gamma wellc
- Page 1354:
FIGURE 20-27. Dose calibrator. Thed
- Page 1358:
The concentration of Mo-99 is most
- Page 1362:
Toss of a coinToss of a dieObservat
- Page 1366:
TABLE 20-3. FRACTIONAL ERRORS(PERCE
- Page 1370:
Multiplication of a number with ran
- Page 1374:
NUCLEAR IMAGING-THESCINTILLATION CA
- Page 1378:
FIGURE 21-1. Modern rectangular hea
- Page 1382:
PulsesfromindividualPMTsPositioncir
- Page 1386:
Image in crystal. .LTtTTTlT1llT1TT.
- Page 1390:
FIGURE 21-7. Ways that x- and gamma
- Page 1394:
front of the collimated camera. Sol
- Page 1398:
distant point source if the collima
- Page 1402:
TABLE 21-2. TYPICAL INTRINSIC PERFO
- Page 1406:
spatial resolution improves (narrow
- Page 1410:
LEHRFan-beamPinhole5 10 15 20 25Obj
- Page 1414:
X and Y correctionlookup tablesDigi
- Page 1418:
methods for measuring the camera pe
- Page 1422:
tangle. The MCA-type display presen
- Page 1426:
lution collimator may improve spati
- Page 1430:
Pairs of digitalposition signalsX 3
- Page 1434:
Image Processing in Nuclear Medicin
- Page 1438:
FIGURE 21-25. End-diastolic (top) a
- Page 1442:
NUCLEAR IMAGING-EMISSIONTOMOGRAPHYT
- Page 1446:
FIGURE 22-1 (continued). (B) double
- Page 1450:
\- -, ffIffIffIffIffI\\\,\\ , \\fIf
- Page 1454:
FIGURE 22-5. SPEeT images created b
- Page 1458:
time, attenuation correction in SPE
- Page 1462:
Radial~-~IIIIIIIIIIIICenterf----at-
- Page 1466:
FIGURE 22-9. Center-of-rotation (CO
- Page 1470:
FIGURE 22-11. Head tilt. The camera
- Page 1474: These phantoms are very useful for
- Page 1478: FIGURE 22-15. True coincidence (lef
- Page 1482: TABLE 22-2. PROPERTIES OF SEVERAL I
- Page 1486: elatively low conversion efficiency
- Page 1490: equire less activity to be administ
- Page 1494: Source containingpositron-emitterDD
- Page 1498: RodSourceFIGURE 22-24. Rod source f
- Page 1502: Some cameras are equipped with filt
- Page 1506: Factors Affecting the Availability
- Page 1510: RADIATIONDOSIMETRY,PROTECTION,AND B
- Page 1516: is exposed to cosmic radiation near
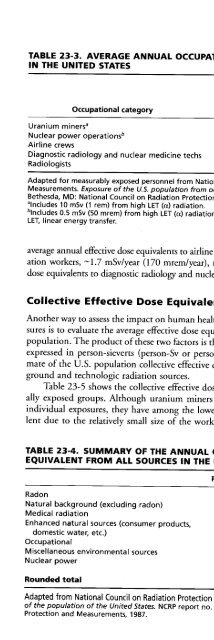
- Page 1520: TABLE 23-1. ESTIMATED AVERAGE TOTAL
- Page 1524: TABLE 23-2. ESTIMATED AVERAGE ANNUA
- Page 1530: TABLE 23-6. ANNUAL GENETICALLY SIGN
- Page 1534: with conventional x-ray film, radia
- Page 1538: FIGURE 23-3. A small chip of LiF (r
- Page 1542: Method Measures Useful rangePermane
- Page 1546: FIGURE 23-6. Portable ion chamber.
- Page 1550: Inverse Square LawE 2 = E 1 (0 1 /0
- Page 1554: adherence to the methods in NCRP re
- Page 1558: espective distances to the point in
- Page 1562: Exposure per week contributed by th
- Page 1566: Primary, scatter, and leakage radia
- Page 1570: IStairwaygQlc..>c19'" 00Waitingarea
- Page 1574: e the minimal thickness recommended
- Page 1578:
Personnel Protection in Diagnostic
- Page 1582:
TABLE 23-14. EXPOSURE RATE CONSTANT
- Page 1586:
Filtration of the polychromatic x-r
- Page 1590:
out ABC. Some systems have a high e
- Page 1594:
the physician with the ability to m
- Page 1598:
nologist in the correct selection o
- Page 1602:
ination should remove their protect
- Page 1606:
labeled with 1-131. 1-131 decays wi
- Page 1610:
Phosphorus-32 is used for the radio
- Page 1614:
clides are the "Standards for Prote
- Page 1618:
TABLE 23-18. NUCLEAR REGULATORY COM
- Page 1622:
National Council on Radiation Prote
- Page 1628:
section 3.5). The old term for ener
- Page 1632:
TABLE 24-3. ABSORBED DOSES TO SELEC
- Page 1636:
Medical x-ray imaging procedures su
- Page 1640:
mAs, and the distance from x-ray so
- Page 1644:
FIGURE 24-3. The geometry fordeterm
- Page 1648:
FIGURE 24-4. Illustration ofSourceo
- Page 1652:
FIGURE 24-6. The cumulated activity
- Page 1656:
TABLE 24-9. VARIABLES IN THE MIRD S
- Page 1660:
not currently require manufacturers
- Page 1664:
TABLE 25-1. DETERMINANTS OF BIOLOGI
- Page 1668:
Radia~?/ 1'{"l20 H+ ow\ Ionization
- Page 1672:
cific ionization (i.e., ionization
- Page 1676:
chromatid aberrations. Unlike chrom
- Page 1680:
10~n ,,,,,,C), ,,I:Dq'S; 1.0 ------
- Page 1684:
ClC 1.0oS;o~::JCJ)~G)0-0C0:;:;(JCIS
- Page 1688:
mediated through free radical produ
- Page 1692:
Radiationdose~~ANSYS~Dose too---. D
- Page 1696:
to normal within 2 to 3 months. If
- Page 1700:
dose delivered over a protracted pe
- Page 1704:
diseases such as ataxia telangiecta
- Page 1708:
The stages of the neurovascular syn
- Page 1712:
Most of the radiation-induced biolo
- Page 1716:
adiation, such as radiofrequency ra
- Page 1720:
TABLE 25-7. SUMMARY OF MAJOR EPIDEM
- Page 1724:
,.,,. ,,.,,.,,.ỊI"", ,I, IIIIIII"
- Page 1728:
Radiationexposure1-",,II, II,,III,
- Page 1732:
the overall risk and relative proba
- Page 1736:
times greater risk for development
- Page 1740:
Estimating Genetic RiskThe genetica
- Page 1744:
sure, owing principally to the rela
- Page 1748:
1/3 for mice). Nevertheless, develo
- Page 1752:
Numberoccurring fromnatural causesE
- Page 1756:
Prenatal death(Some survivors,no in
- Page 1762:
APPENDICES
- Page 1768:
OriginalVector (V)InternationalSyst
- Page 1772:
PotentialEnergyPotential energy is
- Page 1776:
When a charged particle is placed i
- Page 1780:
The joule is a rather large unit of
- Page 1784:
The band theory of solids explains
- Page 1788:
FIGURE A-7. A spinning charge has a
- Page 1792:
Magnetic field moving towards wire
- Page 1796:
Static magnetic fieldRotating curre
- Page 1802:
PHYSICAL CONSTANTS, PREFIXES,GEOMET
- Page 1806:
Appendix B: Physical Constants, Pre
- Page 1810:
MASS ATTENUATIONCOEFFICIENTS AND SP
- Page 1814:
Appendix C: Mass Attenuation Coeffi
- Page 1818:
Appendix C: Mass Attenuation Coeffi
- Page 1822:
Appendix C: Mass Attenuation Coeffi
- Page 1826:
C.6 MAMMOGRAPHY SPECTRA: Rh/RhTABLE
- Page 1830:
Appendix Co' Mass Attenuation Coeff
- Page 1834:
RADIOPHARMACEUTICALCHARACTERISTICS
- Page 1838:
1251Albumin (ONI) IV N/A -20 mL blo
- Page 1842:
153Sm Lexidronam, also IV over a 1-
- Page 1846:
-90% of dose excreted in 3 hr. Prep
- Page 1850:
99mTc-basedmyocardial perfusion age
- Page 1854:
99mTcMacroaggregated 0.16 ts 0.0161
- Page 1858:
TABLE D-4. ABSORBED DOSE ESTIMATES
- Page 1864:
914 Section V: AppendicesMedical Ph
- Page 1868:
ASCII. See American Standard Code f
- Page 1872:
DDAC. See Digital-to-analog convert
- Page 1876:
Electronic switchltimer, exposure t
- Page 1880:
Image magnification, spatial resolu
- Page 1884:
Magnetic resonance imaging (contd.)
- Page 1888:
Phased array, ultrasound, 490Phosph
- Page 1892:
Radiation detection (contd)gas-fill
- Page 1896:
Shoe marks, processor artifacts, 18
- Page 1900:
Two dimensional multi planar acquis
- Page 1906:
"Nope '" no sign of YOur kitten, Ma