- Page 14:
Preface xvAcknowledgmentsForeword x
- Page 18:
Chapter 9: Fluoroscopy 2319.1 Funct
- Page 22:
16.3 Transducers 48316.4 Beam Prope
- Page 26:
B.3 Radiological Data for Elements
- Page 32:
We are deeply grateful to that part
- Page 38:
Can medical physics be interesting
- Page 46:
INTRODUCTION TO MEDICALIMAGINGMedic
- Page 50:
FIGURE 1-2. The chest x-ray is them
- Page 54:
FIGURE 1-4. A computed tomography (
- Page 58:
angles around the patient. These pr
- Page 62:
FIGURE '-8. Sagittal (upper left),
- Page 66:
ducer, which records the returning
- Page 70:
TABLE 1-1. THE LIMITING SPATIAL RES
- Page 76:
WAVELENGTH(nanometers)FREQUENCY(her
- Page 80:
The physical properties of the most
- Page 84:
The energy required to remove an el
- Page 88:
An electron cascade does not always
- Page 92:
160150140130120110100N
- Page 96:
The binding energy can be calculate
- Page 102:
INTERACTION OF RADIATIONWITH MATTER
- Page 106:
x10 3 7becomes electrically neutral
- Page 110:
Electrons can undergo inelastic int
- Page 114:
The nuclide produced by neutron abs
- Page 118:
Compton scattering results in the i
- Page 122:
CharacteristicX-rays:A: 0.6 keV (N~
- Page 126:
10030 \~ r.." Photoelectric Effect
- Page 130:
Attenuation is the removal of photo
- Page 134:
The relationship between material d
- Page 138:
HVL). Most practical applications o
- Page 142:
MFP = 1- = __ 1__ = 1.44 HVLI.l 0.6
- Page 146:
For x- and gamma rays, kerma can be
- Page 150:
1 R = 2.58 X 10- 4 C/kg (exactly)Ra
- Page 154:
TABLE 3-4. RADIATION WEIGHTING FACT
- Page 158:
TABLE 3-6. RADIOLOGICAL QUANTITIES,
- Page 162:
Computers were originally designed
- Page 166:
TABLE 4-2. CONVERSION OF 42 (DECIMA
- Page 170:
Binary Representationof Signed Inte
- Page 174:
Chapter 4: Computers in Medical Ima
- Page 178:
TABLE 4-5. MAXIMAL ERRORS WHEN DIFF
- Page 182:
Main memory is used for these funct
- Page 186:
A CPU fetches and executes the inst
- Page 190:
FIGURE 4-6. Hard-disk drive. Aread/
- Page 194:
Table 4-6 compares the characterist
- Page 198:
erwise identical, the computer with
- Page 202:
function, such as a disk head crash
- Page 206:
Scintillation camera planarSPECTPET
- Page 210:
(1.4 MB/disk)(l,024 2 bytes/MB)/[(6
- Page 214:
DAC converts each digital number to
- Page 218:
UnpolarizedlightHorizontallypolariz
- Page 222:
FIGURE 4-15. Graphs of four transla
- Page 226:
For example, it is often useful to
- Page 234:
X-RAY PRODUCTION, X-RAYTUBES, AND G
- Page 238:
1 _2 -3-1Impact with nucleus:Maximu
- Page 242:
FIGURE 5-4. Generation of a charact
- Page 246:
Cable sockets ~FIGURE 5-6. The majo
- Page 250:
~C1.61.41.2 _~ 1.0::l0 0.8Q).00.62-
- Page 254:
Rotor~~ ~+-statorFIGURE 5-11. The a
- Page 258:
There are three major tradeoffs to
- Page 262:
FIGURE 5-16. Various tools allow me
- Page 266:
5.3 X-RAY TUBE INSERT, TUBE HOUSING
- Page 270:
TABLE 5-3. MINIMUM HALF VALUE LAYER
- Page 274:
Induced electronflow in conductorRe
- Page 278:
Power is the rate of energy product
- Page 282:
used to modulate voltage, autotrans
- Page 286:
mAand mAscontrolPhototimercircuitsF
- Page 290:
(a)Electron flow through single rec
- Page 294:
asic components of a single-phase t
- Page 298:
In three-phase generator designs, h
- Page 302:
greater overall input power). Next,
- Page 306:
nected to the contactors that dose
- Page 310:
600500~5 4001:~•..=:l()300Q).0=:l
- Page 314:
100% Ripple \5% Ripple /\ ••.-
- Page 318:
TABLE 5-6. X-RAY TUBE FOCAL SPOTSIZ
- Page 322:
Chapter 5: X-Ray Production, X-Ray
- Page 326:
of the chart. Like the single-expos
- Page 330:
Projection radiography, the first r
- Page 334:
IEi\\i~eFIGURE 6-2. The sides andhe
- Page 338:
sure on the screens, the cassette m
- Page 342:
version efficiency, the approximate
- Page 346:
(and vice versa). This phenomenon i
- Page 350:
~80o"-'"{)' 70c.~ 60lij 50c.240 .
- Page 354:
film OD. If the screen is made thic
- Page 358:
Film has excellent spatial resoluti
- Page 362:
-(/l~ 2.0-c:8 1.51.0-(/l~ 2.0-c:8 1
- Page 366:
educed latitude. The shaded region
- Page 370:
TABLE 6-2. TISSUE HALF-VALUELAYERS
- Page 374:
PrimaryScatterFIGURE 6-22. A: Scatt
- Page 378:
ferent locations from within the pa
- Page 382:
lar to the direction of the slits.
- Page 386:
FIGURE 6-30. Air gap geometry canre
- Page 392:
silver halidecrystalssensitivityspe
- Page 396:
•FIGURE 7-3. The fate of an expos
- Page 400:
DeveloperActivatorRestrainerPreserv
- Page 404:
increased too much because the numb
- Page 408:
can be achieved. Film manufacturers
- Page 412:
Modern x-ray equipment is computer
- Page 416:
wee en0.25Ol0U. 0.20+Q)(f) 0.15COCO
- Page 422:
Mammography is a radiographic exami
- Page 426:
Other modalities that have been use
- Page 430:
plished by magnetic induction. A so
- Page 434:
ReferenceAxisCentra0AxisProjectedfo
- Page 438:
30 kVp26 kVp30 kVp26 kVp(b)2.01.81.
- Page 442:
OJE 25.E(fl.9 20o~ 15"'___ to 45 x
- Page 446:
TABLE 8-2. REQUIREMENTS FOR MINIMUM
- Page 450:
TerminationCircuitFIGURE 8-15. The
- Page 454:
simulations and experimental measur
- Page 458:
1.21.11.00.90.80.70.60.50.40.30.20.
- Page 462:
2!£.= 1.85 xSODSOD35cmSID65cmOlD30
- Page 466:
Film BaseFilm EmulsionPhosphor Scre
- Page 470:
equiring a compensatory increase in
- Page 474:
0.25 -Base + Fog0.20Density 0.150.1
- Page 478:
characteristic curves, the correspo
- Page 482:
achieving a pixel size at the image
- Page 486:
Chapter 8: Mammography 223TABLE 8-6
- Page 490:
ifies that the mammography facility
- Page 494:
TABLE 8-9. SUMMARY TABLE OF ANNUAL
- Page 498:
preting radiologists, mammography t
- Page 504:
with the fluoroscopy imaging chain
- Page 508:
FIGURE 9-4. A scanningelectron micr
- Page 512:
cm 2 area of the 9-inch-diameter in
- Page 516:
_ 100~I 20 em patient ~~•.... _~-
- Page 520:
Video CamerasGeneral OperationThe c
- Page 524:
FIGURE 9-11. The flat panelimaging
- Page 528:
higher. Cine radiography uses very
- Page 532:
put, and consequently frame averagi
- Page 536:
contrast" selections on the console
- Page 540:
specific applications, such as GIIG
- Page 544:
3'2'E~wtJ)w 0.3~,======_o~"~~--;~ _
- Page 548:
time estimate of the amount of radi
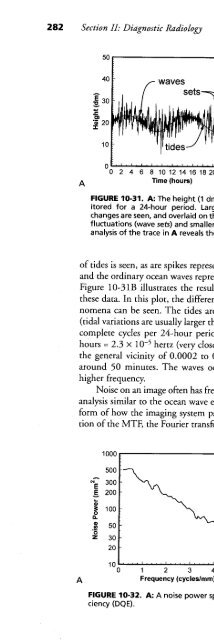
- Page 552: .~! ~i !j t--------------Ij• •s
- Page 556: 'E 2O . O 80(,)~ 100_70-~0CIlIIIr::
- Page 560: 40003500CIl 3000::s~ 2500CIlB 2000U
- Page 564: can be radically changed. Therefore
- Page 568: FIGURE 10-10. A: An isometric displ
- Page 572: FIGURE 10-13. Some physical mechani
- Page 576: some clinical applications, the blu
- Page 580: would correspond to 1 cycle/mm. If
- Page 584: I;:' 0.6irI-:!: 0.41.0 2.0 3.0 4.0S
- Page 588: or stochastic component into the im
- Page 592: ~~2IIIs:::I I>o40 60 80 100 120 140
- Page 596: The term quantum is defined as "som
- Page 600: Stage Description System P System Q
- Page 606: to the calculation of the noise pow
- Page 610: less than twice per cycle, and it w
- Page 614: The sine-shaped MTF for a detector
- Page 618: not just one feature or number, but
- Page 622: --normal••••• m •••
- Page 628: for each exposure. The imaging plat
- Page 632: about 85% BaFBr and 15% BaFI, activ
- Page 636: charge packetsmove in unisonreadout
- Page 640: Flat panel detector systems make us
- Page 644: wires in Fig. 11-8), and the gate i
- Page 648: scintillator(CSI)~TFT detector elem
- Page 652: individual images from each camera
- Page 656:
When film-screen image receptors ar
- Page 660:
FIGURE 11-13. The raw and corrected
- Page 664:
If I'(x,y) > Thigh, then I'(x,y) =
- Page 668:
When the 3 X 3 kernel containing al
- Page 672:
same time, and to archive images us
- Page 676:
FIGURE 12-1. The motion ofthe x-ray
- Page 680:
larger tissue volume is exposed. Th
- Page 684:
cient of jivessel, the mask image (
- Page 688:
3E+3 2E+3I3E+3Ẹ E 2E+3~ 2E+3 ~Ql~
- Page 694:
Computed tomography (CT) is in its
- Page 698:
FIGURE 13-2. A pixel (picture eleme
- Page 702:
--I.....Lobject--I.....L-imageacqui
- Page 706:
Pencil BeamGeometryFan BeamGeometry
- Page 710:
ll:llIidlllidlllielltll:llIi:tlloll
- Page 714:
FIGURE 13-11. A schematic diagram o
- Page 718:
FIGURE 13-13. Multiple detector arr
- Page 722:
cally 0.10 to 0.20 mm on each side.
- Page 726:
5 to 10 mm with the same x-ray tech
- Page 730:
Pitch is a parameter that comes to
- Page 734:
FIGURE 13-20. The sinogram is an im
- Page 738:
The raw data acquired by a CT scann
- Page 742:
lesion~CT# I !, ,c... Z ~ominal sli
- Page 746:
esents an individual measurement of
- Page 750:
in the data, but in x-ray images th
- Page 754:
titative CT techniques can be used
- Page 758:
W = 4095, L = 1048 W=600,L=-100 W =
- Page 762:
FIGURE 13-34. A volume-rendered ima
- Page 766:
ent than in radiography, because of
- Page 770:
TABLE 13-1. TYPICAL COMPUTED TOMOGR
- Page 774:
the high SNR detected in the thinne
- Page 778:
Patient motion: If there is involun
- Page 782:
FIGURE 13-40. A: A beam-hardening a
- Page 786:
Nuclear magnetic resonance (NMR) is
- Page 790:
conceptualized as the number of mag
- Page 794:
Spinning proton withdipole magnetic
- Page 798:
TABLE 14-3. GYROMAGNETIC RATIO FOR
- Page 802:
FIGURE 14-6. Longitudinal magnetiza
- Page 806:
From the classical physics viewpoin
- Page 810:
ways. A 90-degree angle provides th
- Page 814:
spin-spin interactions by themselve
- Page 818:
:~Med~;:rtV~~OUS:Small, aqueous:~ ~
- Page 822:
FatLiverMuscleWhite matterGray matt
- Page 826:
90 0pulse180 0pulse180 0pulse180 0p
- Page 830:
The equation shows that for the sam
- Page 834:
Mz 1,Longitudinal recovery (T1 )Ima
- Page 838:
TABLE 14-5. SPIN ECHO PULSE SEQUENC
- Page 842:
tization when a short TI is used. T
- Page 846:
FIGURE 14-28. Magnetic resonance se
- Page 850:
generated with smaller flip angles
- Page 854:
FIGURE 14-31. A steady-state gradie
- Page 858:
Even-echo rephasing is a phenomenon
- Page 862:
loss than those of lesser water mob
- Page 866:
Price RR. The AAPM/RSNA physics tut
- Page 872:
Linear changein magnetic fieldSuper
- Page 876:
TABLE 15-1. PRECESSIONAL FREQUENCY
- Page 880:
- 0-40 -30 -20 -10 10 20 30 40(1)-0
- Page 884:
Frequency Encode GradientThe freque
- Page 888:
Position of the spins in the third
- Page 892:
15.2 "K-SPACE" DATA ACQUISITION AND
- Page 896:
RF pulses~ _J!~e_a~ Yd~h_qi!.t~r:e_
- Page 900:
peripheral areas (Fig. 15-16E) isol
- Page 904:
Acquired data:% matrix + 1 lineD-f
- Page 908:
TR180 0excitation90 0readout180 0re
- Page 912:
"effective" echo time occurs at a t
- Page 916:
15.3 THREE-DIMENSIONAL FOURIER TRAN
- Page 920:
Signal·to-NoiseRatioThe signal-to-
- Page 924:
image acquisition. Eddy currents ar
- Page 928:
of the blood. Since the detectable
- Page 932:
YTExcitation I-- I#1TExcitation 1--
- Page 936:
Magnetic susceptibility can be quit
- Page 940:
computeroptimizedprofile"rectangula
- Page 944:
since the evolution of the echo sig
- Page 948:
3-4 ppm difference, fat-5 ppm diffe
- Page 952:
Frequency synthesis of object (harm
- Page 956:
15.7 INSTRUMENTATIONMagnetThe magne
- Page 960:
Permanent magnets rely on the ferro
- Page 964:
Superconductive magnets produce ext
- Page 968:
TABLE 15-2. RECOMMENDED QUALITY CON
- Page 972:
TABLE 15-3. MAGNETIC RESONANCE IMAG
- Page 978:
Ultrasound is the term that describ
- Page 982:
"Plane-piston"mechanicaldisplacemen
- Page 986:
FIGURE 16-3. Ultrasound wavelength
- Page 990:
Sound energy causes particle displa
- Page 994:
TABLE 16-3. ACOUSTIC IMPEDANCE, Z =
- Page 998:
TABLE 16-4. PRESSURE AND REFLECTION
- Page 1002:
echoes typically have similar echo
- Page 1006:
The echo intensity is one hundredth
- Page 1010:
Equilibrium:No surface chargeEquili
- Page 1014:
i] ,A0.8 0.9 10 1.1flf O"[:f: L~0.5
- Page 1018:
then filled with an epoxy resin to
- Page 1022:
Transducer elementDiameter, dLength
- Page 1026:
and 36.4 cm, respectively. Lateral
- Page 1030:
SummedSignalFIGURE 16-18. Dynamic r
- Page 1034:
amplitude of the peripheral transdu
- Page 1038:
Phased arraytransducerLateral -reso
- Page 1042:
iUnderstanding ultrasonic image for
- Page 1046:
teristics of the transducer element
- Page 1050:
Pre-amplificationand swept gainI Di
- Page 1054:
OJ'0~BeforeTGC 0.E
- Page 1058:
---------_+-Time...................
- Page 1062:
FIGURE 16-33. Articulating arm B-mo
- Page 1066:
eturning echoes. The ultrasound bea
- Page 1070:
apher must consider the compromises
- Page 1074:
Ultrasound Contrast AgentsUltrasoun
- Page 1078:
Harmonics build in relative intensi
- Page 1082:
Linear components(tissue)Non-linear
- Page 1086:
Mechanical:Transducer~Rotating acou
- Page 1090:
(width and height, respectively) of
- Page 1094:
(i\ I)ThroughtransmissionLow _" Hig
- Page 1098:
MirrorimageFIGURE 16-44 (continued)
- Page 1102:
error by neglecting the velocity of
- Page 1106:
shift measurement because a narrow
- Page 1110:
Each Doppler pulse does not contain
- Page 1114:
t IE«-f maxo~ __ Frequency(Velocit
- Page 1118:
AliasingAliasing, as described earl
- Page 1122:
speed of sound. Measured velocity (
- Page 1126:
6E0.s:::. 8-a.low scatter targets d
- Page 1130:
horizontal targets (lateral resolut
- Page 1134:
ultrasound used to enhance image qu
- Page 1138:
Thermal and mechanical indices of u
- Page 1142:
10'" ..!2 ES>-+"'"00 cQ)E+"'0.110 1
- Page 1148:
cylindrical cable with a central co
- Page 1152:
On most networks today, when two no
- Page 1156:
sic (nonswitched) forms of Ethernet
- Page 1160:
lion distinct addresses. The first
- Page 1164:
Typical data transfer rates of mode
- Page 1168:
Picture Archiving and Communication
- Page 1172:
TeleradiologyTeleradiology can prov
- Page 1176:
DigitalImageFIGURE 17-6. Charge-cou
- Page 1180:
serving nuclear medicine, whereas a
- Page 1184:
Multi-terabyteArchiveFIGURE 17-8. R
- Page 1188:
computer or by specialized hardware
- Page 1192:
Standard viewboxMammography viewbox
- Page 1196:
An application program on the works
- Page 1200:
CollimatorlensiBeammodulatorFIGURE
- Page 1204:
An example of a fault-tolerant stra
- Page 1210:
NUCLEARMEDICINE
- Page 1216:
TABLE 18-1. UNITS AND PREFIXES ASSO
- Page 1220:
II25 ~--------20 : :III12.5 . - - -
- Page 1224:
Beta-minus (~-) decay, or negatron
- Page 1228:
When they lose all (or most) of the
- Page 1232:
Each radionuclide's decay process i
- Page 1236:
MOL YBDENUM-99Beta-Minus DecayT1/2
- Page 1240:
FLUORINE-18Electron Capture and Bet
- Page 1244:
Alternating {_Voltage ~Magnetic fie
- Page 1248:
FIGURE 19-3. Hospital-based cyclotr
- Page 1252:
The total energy released by the nu
- Page 1256:
Radiation DetectorsNeutron Beam Hol
- Page 1260:
ProductionmethodNuclear reactor Nuc
- Page 1264:
that shows details of the generator
- Page 1268:
10087.5..•..•.-c::Q)u•..Q)D.-
- Page 1272:
TABLE 19-3. PHYSICAL CHARACTERISTIC
- Page 1276:
septa (see Chapter 21). A radiophar
- Page 1280:
mediated by the energy-dependent Na
- Page 1284:
depending on the solvent, either re
- Page 1288:
(ii) The total dosage (i.e., admini
- Page 1292:
nal. For other applications, photog
- Page 1296:
are often operated in current mode
- Page 1300:
20.2 GAS-FILLED DETECTORSBasic Prin
- Page 1304:
Because gas multiplication does not
- Page 1308:
is extensively used in biomedical r
- Page 1312:
constituent elements and their low
- Page 1316:
visiblelight -...photon+photocathod
- Page 1320:
In crystalline materials, electrons
- Page 1324:
of the diode and the negative polar
- Page 1328:
FIGURE 20-13. Function of asingle-c
- Page 1332:
Nal (TI)crystal..-r--..IIIIPMT...-r
- Page 1336:
Spectrum of Cesium-137The spectrum
- Page 1340:
with the emission of a 140.5-keV ga
- Page 1344:
FIGURE 20-22. Pulse pileup.The dash
- Page 1348:
distance, typically 20 to 25 cm, fr
- Page 1352:
its samples ofI-125 and Co-57 to ac
- Page 1356:
Dose Calibrator Quality AssuranceBe
- Page 1360:
Two measures of the central tendenc
- Page 1364:
4Number of SuccessesFIGURE 20-28. B
- Page 1368:
For example, a counr of 853 is obra
- Page 1372:
entering the standard deviations fr
- Page 1376:
dose to the patient, nearly all nuc
- Page 1380:
PhotomultipliertubesLucite light pi
- Page 1384:
PulsesfromindividualPMTsAnalogJ....
- Page 1388:
the object is moved yet farther fro
- Page 1392:
TABLE 21-1. COMPARISON OF SINGLE·P
- Page 1396:
Some types of collimators magnify (
- Page 1400:
the product of three factors: the c
- Page 1404:
() 0.5c CD"0If=CD.>
- Page 1408:
TABLE 21-3. THE EFFECT OF INCREASIN
- Page 1412:
6.4 mm at 10 cm from the collimator
- Page 1416:
Digital'positionZ correctionlookup
- Page 1420:
two ways that scintillation cametas
- Page 1424:
quency of this testing depends on t
- Page 1428:
ufacturers incorporate a computer f
- Page 1432:
FirstimageSecondimageThirdimageFour
- Page 1436:
pool image sequence, using T c-99m-
- Page 1440:
adionuclides in patients, using a p
- Page 1444:
mator, which never enjoyed wide acc
- Page 1448:
heads of a SPECT system produced id
- Page 1452:
0.50.4CD"0:e0.3c.E 0.2
- Page 1456:
No AttenuationCorrectionAttenuation
- Page 1460:
camera heads that revolve about the
- Page 1464:
In planar nuclear imaging, radioact
- Page 1468:
FIGURE 22-10. Image of a cylinder f
- Page 1472:
TABLE 22-1. RECOMMENDED SCHEDULE FO
- Page 1476:
Design and Principles Of OperationA
- Page 1480:
2 by 2 arrayof PMTs~Slits cut intoB
- Page 1484:
To detect coincidences, the times o
- Page 1488:
DetectorelementsSeptalcollimatorrin
- Page 1492:
J......... ······~~~~~I thiC
- Page 1496:
FIGURE 22-23. Attenuationin PET. Th
- Page 1500:
511-keV collimators and because the
- Page 1504:
A system provided by another vendor
- Page 1508:
Madsen MT. The AAPM/RSNA physics tu
- Page 1514:
It is incumbent upon all individual
- Page 1518:
(5 mrad/hr), which is approximately
- Page 1522:
combustible fuels, including coal a
- Page 1526:
TABLE 23-3. AVERAGE ANNUAL OCCUPATI
- Page 1530:
TABLE 23-6. ANNUAL GENETICALLY SIGN
- Page 1534:
with conventional x-ray film, radia
- Page 1538:
FIGURE 23-3. A small chip of LiF (r
- Page 1542:
Method Measures Useful rangePermane
- Page 1546:
FIGURE 23-6. Portable ion chamber.
- Page 1550:
Inverse Square LawE 2 = E 1 (0 1 /0
- Page 1554:
adherence to the methods in NCRP re
- Page 1558:
espective distances to the point in
- Page 1562:
Exposure per week contributed by th
- Page 1566:
Primary, scatter, and leakage radia
- Page 1570:
IStairwaygQlc..>c19'" 00Waitingarea
- Page 1574:
e the minimal thickness recommended
- Page 1578:
Personnel Protection in Diagnostic
- Page 1582:
TABLE 23-14. EXPOSURE RATE CONSTANT
- Page 1586:
Filtration of the polychromatic x-r
- Page 1590:
out ABC. Some systems have a high e
- Page 1594:
the physician with the ability to m
- Page 1598:
nologist in the correct selection o
- Page 1602:
ination should remove their protect
- Page 1606:
labeled with 1-131. 1-131 decays wi
- Page 1610:
Phosphorus-32 is used for the radio
- Page 1614:
clides are the "Standards for Prote
- Page 1618:
TABLE 23-18. NUCLEAR REGULATORY COM
- Page 1622:
National Council on Radiation Prote
- Page 1628:
section 3.5). The old term for ener
- Page 1632:
TABLE 24-3. ABSORBED DOSES TO SELEC
- Page 1636:
Medical x-ray imaging procedures su
- Page 1640:
mAs, and the distance from x-ray so
- Page 1644:
FIGURE 24-3. The geometry fordeterm
- Page 1648:
FIGURE 24-4. Illustration ofSourceo
- Page 1652:
FIGURE 24-6. The cumulated activity
- Page 1656:
TABLE 24-9. VARIABLES IN THE MIRD S
- Page 1660:
not currently require manufacturers
- Page 1664:
TABLE 25-1. DETERMINANTS OF BIOLOGI
- Page 1668:
Radia~?/ 1'{"l20 H+ ow\ Ionization
- Page 1672:
cific ionization (i.e., ionization
- Page 1676:
chromatid aberrations. Unlike chrom
- Page 1680:
10~n ,,,,,,C), ,,I:Dq'S; 1.0 ------
- Page 1684:
ClC 1.0oS;o~::JCJ)~G)0-0C0:;:;(JCIS
- Page 1688:
mediated through free radical produ
- Page 1692:
Radiationdose~~ANSYS~Dose too---. D
- Page 1696:
to normal within 2 to 3 months. If
- Page 1700:
dose delivered over a protracted pe
- Page 1704:
diseases such as ataxia telangiecta
- Page 1708:
The stages of the neurovascular syn
- Page 1712:
Most of the radiation-induced biolo
- Page 1716:
adiation, such as radiofrequency ra
- Page 1720:
TABLE 25-7. SUMMARY OF MAJOR EPIDEM
- Page 1724:
,.,,. ,,.,,.,,.ỊI"", ,I, IIIIIII"
- Page 1728:
Radiationexposure1-",,II, II,,III,
- Page 1732:
the overall risk and relative proba
- Page 1736:
times greater risk for development
- Page 1740:
Estimating Genetic RiskThe genetica
- Page 1744:
sure, owing principally to the rela
- Page 1748:
1/3 for mice). Nevertheless, develo
- Page 1752:
Numberoccurring fromnatural causesE
- Page 1756:
Prenatal death(Some survivors,no in
- Page 1762:
APPENDICES
- Page 1768:
OriginalVector (V)InternationalSyst
- Page 1772:
PotentialEnergyPotential energy is
- Page 1776:
When a charged particle is placed i
- Page 1780:
The joule is a rather large unit of
- Page 1784:
The band theory of solids explains
- Page 1788:
FIGURE A-7. A spinning charge has a
- Page 1792:
Magnetic field moving towards wire
- Page 1796:
Static magnetic fieldRotating curre
- Page 1802:
PHYSICAL CONSTANTS, PREFIXES,GEOMET
- Page 1806:
Appendix B: Physical Constants, Pre
- Page 1810:
MASS ATTENUATIONCOEFFICIENTS AND SP
- Page 1814:
Appendix C: Mass Attenuation Coeffi
- Page 1818:
Appendix C: Mass Attenuation Coeffi
- Page 1822:
Appendix C: Mass Attenuation Coeffi
- Page 1826:
C.6 MAMMOGRAPHY SPECTRA: Rh/RhTABLE
- Page 1830:
Appendix Co' Mass Attenuation Coeff
- Page 1834:
RADIOPHARMACEUTICALCHARACTERISTICS
- Page 1838:
1251Albumin (ONI) IV N/A -20 mL blo
- Page 1842:
153Sm Lexidronam, also IV over a 1-
- Page 1846:
-90% of dose excreted in 3 hr. Prep
- Page 1850:
99mTc-basedmyocardial perfusion age
- Page 1854:
99mTcMacroaggregated 0.16 ts 0.0161
- Page 1858:
TABLE D-4. ABSORBED DOSE ESTIMATES
- Page 1864:
914 Section V: AppendicesMedical Ph
- Page 1868:
ASCII. See American Standard Code f
- Page 1872:
DDAC. See Digital-to-analog convert
- Page 1876:
Electronic switchltimer, exposure t
- Page 1880:
Image magnification, spatial resolu
- Page 1884:
Magnetic resonance imaging (contd.)
- Page 1888:
Phased array, ultrasound, 490Phosph
- Page 1892:
Radiation detection (contd)gas-fill
- Page 1896:
Shoe marks, processor artifacts, 18
- Page 1900:
Two dimensional multi planar acquis
- Page 1906:
"Nope '" no sign of YOur kitten, Ma