2014-2015_factbook_2
2014-2015_factbook_2
2014-2015_factbook_2

Create successful ePaper yourself
Turn your PDF publications into a flip-book with our unique Google optimized e-Paper software.
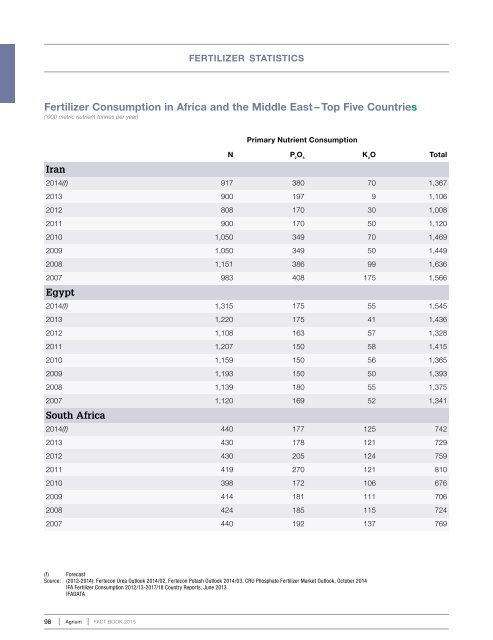
fertilizer statisticsFertilizer Consumption in Africa and the Middle East – Top Five Countries(‘000 metric nutrient tonnes per year)IranPrimary Nutrient ConsumptionN P 2O 5K 2O Total<strong>2014</strong>(f) 917 380 70 1,3672013 900 197 9 1,1062012 808 170 30 1,0082011 900 170 50 1,1202010 1,050 349 70 1,4692009 1,050 349 50 1,4492008 1,151 386 99 1,6362007 983 408 175 1,566Egypt<strong>2014</strong>(f) 1,315 175 55 1,5452013 1,220 175 41 1,4362012 1,108 163 57 1,3282011 1,207 150 58 1,4152010 1,159 150 56 1,3652009 1,193 150 50 1,3932008 1,139 180 55 1,3752007 1,120 169 52 1,341South Africa<strong>2014</strong>(f) 440 177 125 7422013 430 178 121 7292012 430 205 124 7592011 419 270 121 8102010 398 172 106 6762009 414 181 111 7062008 424 185 115 7242007 440 192 137 769(f) ForecastSource: (2012-<strong>2014</strong>): Fertecon Urea Outlook <strong>2014</strong>/02, Fertecon Potash Outlook <strong>2014</strong>/03, CRU Phosphate Fertilizer Market Outlook, October <strong>2014</strong>IFA Fertilizer Consumption 2012/13-2017/18 Country Reports, June 2013IFADATA98 Agrium FACT BOOK <strong>2015</strong>