2014-2015_factbook_2
2014-2015_factbook_2
2014-2015_factbook_2

Create successful ePaper yourself
Turn your PDF publications into a flip-book with our unique Google optimized e-Paper software.
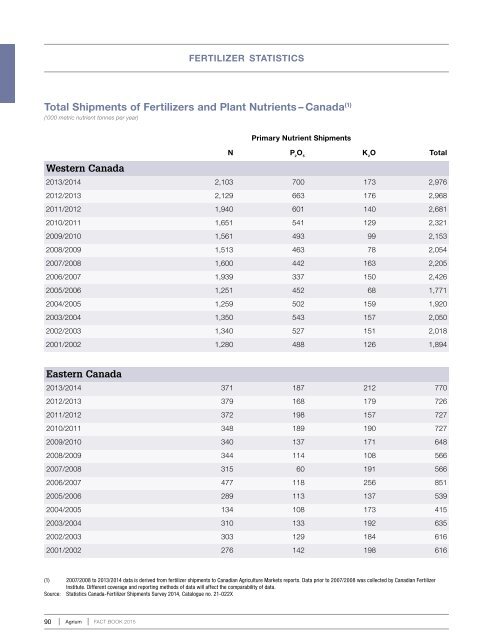
fertilizer statisticsTotal Shipments of Fertilizers and Plant Nutrients – Canada (1)(‘000 metric nutrient tonnes per year)Western CanadaPrimary Nutrient ShipmentsN P 2O 5K 2O Total2013/<strong>2014</strong> 2,103 700 173 2,9762012/2013 2,129 663 176 2,9682011/2012 1,940 601 140 2,6812010/2011 1,651 541 129 2,3212009/2010 1,561 493 99 2,1532008/2009 1,513 463 78 2,0542007/2008 1,600 442 163 2,2052006/2007 1,939 337 150 2,4262005/2006 1,251 452 68 1,7712004/2005 1,259 502 159 1,9202003/2004 1,350 543 157 2,0502002/2003 1,340 527 151 2,0182001/2002 1,280 488 126 1,894Eastern Canada2013/<strong>2014</strong> 371 187 212 7702012/2013 379 168 179 7262011/2012 372 198 157 7272010/2011 348 189 190 7272009/2010 340 137 171 6482008/2009 344 114 108 5662007/2008 315 60 191 5662006/2007 477 118 256 8512005/2006 289 113 137 5392004/2005 134 108 173 4152003/2004 310 133 192 6352002/2003 303 129 184 6162001/2002 276 142 198 616(1) 2007/2008 to 2013/<strong>2014</strong> data is derived from fertilizer shipments to Canadian Agriculture Markets reports. Data prior to 2007/2008 was collected by Canadian FertilizerInstitute. Different coverage and reporting methods of data will affect the comparability of data.Source: Statistics Canada-Fertilizer Shipments Survey <strong>2014</strong>, Catalogue no. 21-022X90 Agrium FACT BOOK <strong>2015</strong>