2014-2015_factbook_2
2014-2015_factbook_2
2014-2015_factbook_2

Create successful ePaper yourself
Turn your PDF publications into a flip-book with our unique Google optimized e-Paper software.
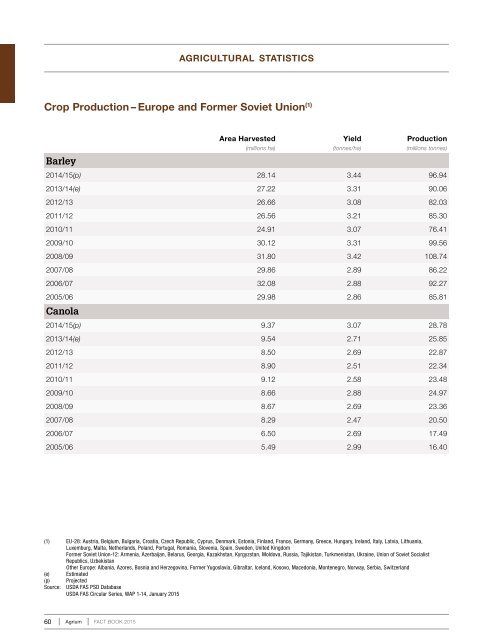
agricultural statisticsCrop Production – Europe and Former Soviet Union (1)BarleyArea HarvestedYieldProduction(millions ha)(tonnes/ha)(millions tonnes)<strong>2014</strong>/15(p) 28.14 3.44 96.942013/14(e) 27.22 3.31 90.062012/13 26.66 3.08 82.032011/12 26.56 3.21 85.302010/11 24.91 3.07 76.412009/10 30.12 3.31 99.562008/09 31.80 3.42 108.742007/08 29.86 2.89 86.222006/07 32.08 2.88 92.272005/06 29.98 2.86 85.81Canola<strong>2014</strong>/15(p) 9.37 3.07 28.782013/14(e) 9.54 2.71 25.852012/13 8.50 2.69 22.872011/12 8.90 2.51 22.342010/11 9.12 2.58 23.482009/10 8.66 2.88 24.972008/09 8.67 2.69 23.362007/08 8.29 2.47 20.502006/07 6.50 2.69 17.492005/06 5.49 2.99 16.40(1) EU-28: Austria, Belgium, Bulgaria, Croatia, Czech Republic, Cyprus, Denmark, Estonia, Finland, France, Germany, Greece, Hungary, Ireland, Italy, Latvia, Lithuania,Luxemburg, Malta, Netherlands, Poland, Portugal, Romania, Slovenia, Spain, Sweden, United KingdomFormer Soviet Union-12: Armenia, Azerbaijan, Belarus, Georgia, Kazakhstan, Kyrgyzstan, Moldova, Russia, Tajikistan, Turkmenistan, Ukraine, Union of Soviet SocialistRepublics, UzbekistanOther Europe: Albania, Azores, Bosnia and Herzegovina, Former Yugoslavia, Gibraltar, Iceland, Kosovo, Macedonia, Montenegro, Norway, Serbia, Switzerland(e) Estimated(p) ProjectedSource: USDA FAS PSD DatabaseUSDA FAS Circular Series, WAP 1-14, January <strong>2015</strong>60 Agrium FACT BOOK <strong>2015</strong>