2014-2015_factbook_2
2014-2015_factbook_2
2014-2015_factbook_2

Create successful ePaper yourself
Turn your PDF publications into a flip-book with our unique Google optimized e-Paper software.
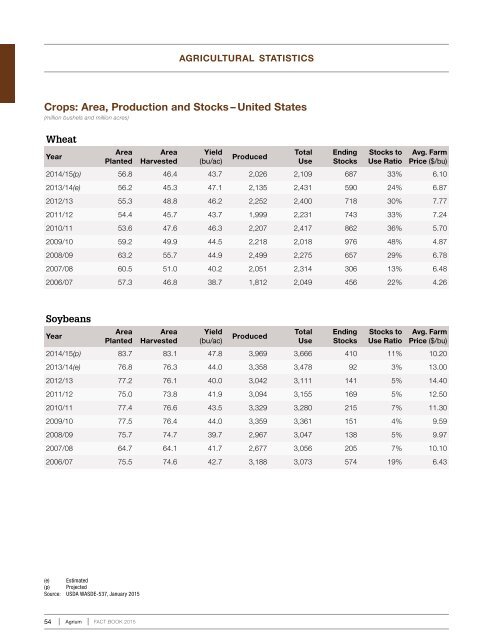
agricultural statisticsCrops: Area, Production and Stocks – United States(million bushels and million acres)WheatYearAreaPlantedAreaHarvestedYield(bu/ac)ProducedTotalUseEndingStocksStocks toUse RatioAvg. FarmPrice ($/bu)<strong>2014</strong>/15(p) 56.8 46.4 43.7 2,026 2,109 687 33% 6.102013/14(e) 56.2 45.3 47.1 2,135 2,431 590 24% 6.872012/13 55.3 48.8 46.2 2,252 2,400 718 30% 7.772011/12 54.4 45.7 43.7 1,999 2,231 743 33% 7.242010/11 53.6 47.6 46.3 2,207 2,417 862 36% 5.702009/10 59.2 49.9 44.5 2,218 2,018 976 48% 4.872008/09 63.2 55.7 44.9 2,499 2,275 657 29% 6.782007/08 60.5 51.0 40.2 2,051 2,314 306 13% 6.482006/07 57.3 46.8 38.7 1,812 2,049 456 22% 4.26SoybeansYearAreaPlantedAreaHarvestedYield(bu/ac)ProducedTotalUseEndingStocksStocks toUse RatioAvg. FarmPrice ($/bu)<strong>2014</strong>/15(p) 83.7 83.1 47.8 3,969 3,666 410 11% 10.202013/14(e) 76.8 76.3 44.0 3,358 3,478 92 3% 13.002012/13 77.2 76.1 40.0 3,042 3,111 141 5% 14.402011/12 75.0 73.8 41.9 3,094 3,155 169 5% 12.502010/11 77.4 76.6 43.5 3,329 3,280 215 7% 11.302009/10 77.5 76.4 44.0 3,359 3,361 151 4% 9.592008/09 75.7 74.7 39.7 2,967 3,047 138 5% 9.972007/08 64.7 64.1 41.7 2,677 3,056 205 7% 10.102006/07 75.5 74.6 42.7 3,188 3,073 574 19% 6.43(e) Estimated(p) ProjectedSource: USDA WASDE-537, January <strong>2015</strong>54 Agrium FACT BOOK <strong>2015</strong>