2014-2015_factbook_2
2014-2015_factbook_2
2014-2015_factbook_2

You also want an ePaper? Increase the reach of your titles
YUMPU automatically turns print PDFs into web optimized ePapers that Google loves.
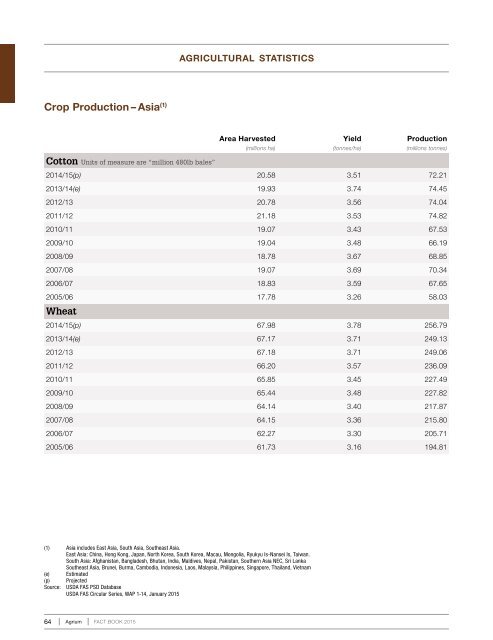
agricultural statisticsCrop Production – Asia (1)Area Harvested(millions ha)Yield(tonnes/ha)Production(millions tonnes)Cotton Units of measure are “million 480lb bales”<strong>2014</strong>/15(p) 20.58 3.51 72.212013/14(e) 19.93 3.74 74.452012/13 20.78 3.56 74.042011/12 21.18 3.53 74.822010/11 19.07 3.43 67.532009/10 19.04 3.48 66.192008/09 18.78 3.67 68.852007/08 19.07 3.69 70.342006/07 18.83 3.59 67.652005/06 17.78 3.26 58.03Wheat<strong>2014</strong>/15(p) 67.98 3.78 256.792013/14(e) 67.17 3.71 249.132012/13 67.18 3.71 249.062011/12 66.20 3.57 236.092010/11 65.85 3.45 227.492009/10 65.44 3.48 227.822008/09 64.14 3.40 217.872007/08 64.15 3.36 215.802006/07 62.27 3.30 205.712005/06 61.73 3.16 194.81(1) Asia includes East Asia, South Asia, Southeast Asia.East Asia: China, Hong Kong, Japan, North Korea, South Korea, Macau, Mongolia, Ryukyu Is-Nansei Is, Taiwan.South Asia: Afghanistan, Bangladesh, Bhutan, India, Maldives, Nepal, Pakistan, Southern Asia NEC, Sri LankaSoutheast Asia, Brunei, Burma, Cambodia, Indonesia, Laos, Malaysia, Philippines, Singapore, Thailand, Vietnam(e) Estimated(p) ProjectedSource: USDA FAS PSD DatabaseUSDA FAS Circular Series, WAP 1-14, January <strong>2015</strong>64 Agrium FACT BOOK <strong>2015</strong>