2014-2015_factbook_2
2014-2015_factbook_2
2014-2015_factbook_2

Create successful ePaper yourself
Turn your PDF publications into a flip-book with our unique Google optimized e-Paper software.
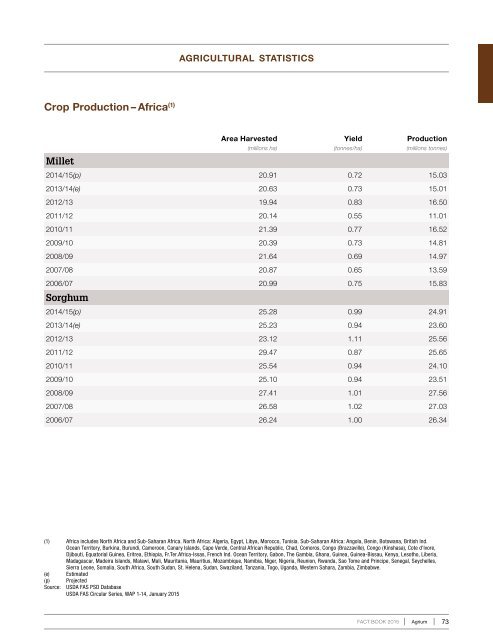
agricultural statisticsCrop Production – Africa (1)MilletArea HarvestedYieldProduction(millions ha)(tonnes/ha)(millions tonnes)<strong>2014</strong>/15(p) 20.91 0.72 15.032013/14(e) 20.63 0.73 15.012012/13 19.94 0.83 16.502011/12 20.14 0.55 11.012010/11 21.39 0.77 16.522009/10 20.39 0.73 14.812008/09 21.64 0.69 14.972007/08 20.87 0.65 13.592006/07 20.99 0.75 15.83Sorghum<strong>2014</strong>/15(p) 25.28 0.99 24.912013/14(e) 25.23 0.94 23.602012/13 23.12 1.11 25.562011/12 29.47 0.87 25.652010/11 25.54 0.94 24.102009/10 25.10 0.94 23.512008/09 27.41 1.01 27.562007/08 26.58 1.02 27.032006/07 26.24 1.00 26.34(1) Africa includes North Africa and Sub-Saharan Africa. North Africa: Algeria, Egypt, Libya, Morocco, Tunisia. Sub-Saharan Africa: Angola, Benin, Botswana, British Ind.Ocean Territory, Burkina, Burundi, Cameroon, Canary Islands, Cape Verde, Central African Republic, Chad, Comoros, Congo (Brazzaville), Congo (Kinshasa), Cote d’Ivore,Djibouti, Equatorial Guinea, Eritrea, Ethiopia, Fr.Ter.Africa-Issas, French Ind. Ocean Territory, Gabon, The Gambia, Ghana, Guinea, Guinea-Bissau, Kenya, Lesotho, Liberia,Madagascar, Madeira Islands, Malawi, Mali, Mauritania, Mauritius, Mozambique, Namibia, Niger, Nigeria, Reunion, Rwanda, Sao Tome and Principe, Senegal, Seychelles,Sierra Leone, Somalia, South Africa, South Sudan, St. Helena, Sudan, Swaziland, Tanzania, Togo, Uganda, Western Sahara, Zambia, Zimbabwe.(e) Estimated(p) ProjectedSource: USDA FAS PSD DatabaseUSDA FAS Circular Series, WAP 1-14, January <strong>2015</strong>FACT BOOK <strong>2015</strong>Agrium 73