2014-2015_factbook_2
2014-2015_factbook_2
2014-2015_factbook_2

You also want an ePaper? Increase the reach of your titles
YUMPU automatically turns print PDFs into web optimized ePapers that Google loves.
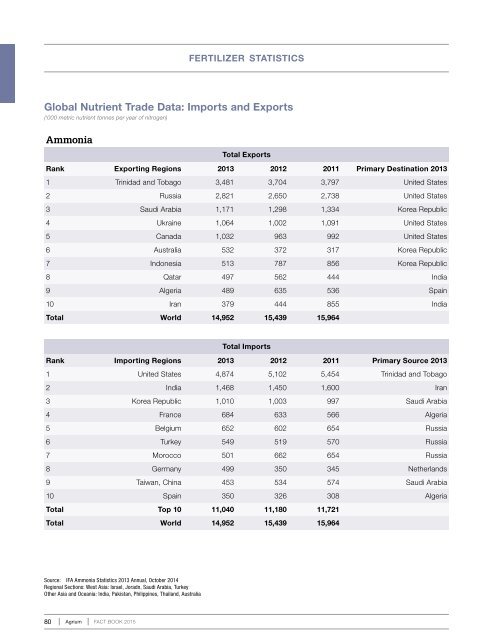
fertilizer statisticsGlobal Nutrient Trade Data: Imports and Exports(‘000 metric nutrient tonnes per year of nitrogen)AmmoniaTotal ExportsRank Exporting Regions 2013 2012 2011 Primary Destination 20131 Trinidad and Tobago 3,481 3,704 3,797 United States2 Russia 2,821 2,650 2,738 United States3 Saudi Arabia 1,171 1,298 1,334 Korea Republic4 Ukraine 1,064 1,002 1,091 United States5 Canada 1,032 963 992 United States6 Australia 532 372 317 Korea Republic7 Indonesia 513 787 856 Korea Republic8 Qatar 497 562 444 India9 Algeria 489 635 536 Spain10 Iran 379 444 855 IndiaTotal World 14,952 15,439 15,964Total ImportsRank Importing Regions 2013 2012 2011 Primary Source 20131 United States 4,874 5,102 5,454 Trinidad and Tobago2 India 1,468 1,450 1,600 Iran3 Korea Republic 1,010 1,003 997 Saudi Arabia4 France 684 633 566 Algeria5 Belgium 652 602 654 Russia6 Turkey 549 519 570 Russia7 Morocco 501 662 654 Russia8 Germany 499 350 345 Netherlands9 Taiwan, China 453 534 574 Saudi Arabia10 Spain 350 326 308 AlgeriaTotal Top 10 11,040 11,180 11,721Total World 14,952 15,439 15,964Source: IFA Ammonia Statistics 2013 Annual, October <strong>2014</strong>Regional Sections: West Asia: Israel, Joradn, Saudi Arabia, TurkeyOther Asia and Oceania: India, Pakistan, Philippines, Thailand, Australia80 Agrium FACT BOOK <strong>2015</strong>