agricultural statisticsPlanted Area and Production by Crop – Western CanadaArea (1)(‘000 of acres)<strong>2014</strong>(e) 2013 2012 2011 2010 2009 2008 2007Winter Wheat 875 935 1,245 619 605 915 1,370 1,050Spring Wheat 17,158 18,818 16,720 15,496 16,159 16,705 15,930 14,787Durum Wheat 4,750 4,965 4,680 4,011 3,150 5,660 6,030 4,765Oats 2,478 2,860 2,548 2,879 2,585 3,315 3,930 4,890Barley 5,554 6,695 7,005 6,191 6,405 8,150 8,780 10,255Rye 210 225 300 260 275 365 350 300Flaxseed 1,555 1,050 980 740 915 1,685 1,560 1,305Canola 20,255 19,835 21,895 18,860 17,475 16,450 16,060 15,700Peas 3,795 3,325 3,730 2,436 3,625 3,760 3,985 3,630Major Crops 56,630 58,708 59,102 51,491 51,194 57,006 57,995 56,681Summer Fallow 4,595 3,800 4,335 11,763 10,671 5,936 5,951 7,065Production(‘000 of tonnes)<strong>2014</strong>(e) 2013 2012 2011 2010 2009 2008 2007Winter Wheat 1,203 1,468 1,949 825 869 1,119 1,983 1,389Spring Wheat 20,880 26,939 18,540 17,719 17,169 18,132 17,904 13,361Durum Wheat 5,193 6,505 4,627 4,172 3,025 5,400 5,519 3,681Oats 2,615 3,607 2,495 2,839 2,071 2,579 3,959 4,210Barley 6,702 9,748 7,489 7,432 6,984 8,925 11,214 10,238Rye 154 194 307 210 197 243 252 209Flaxseed 847 724 489 399 419 915 861 634Canola 15,496 17,876 13,767 14,498 12,688 12,830 12,560 9,555Peas 3,445 3,961 3,341 2,502 3,018 3,379 3,565 2,935Major Crops 56,535 71,022 53,002 50,597 46,439 53,521 57,816 46,211(1) Refers to seeded area.(e) EstimatedSource: CANSIM Table 001-0010, Statistics Canada, January <strong>2015</strong>. All Source data now taken from CANSIM table.56 Agrium FACT BOOK <strong>2015</strong>
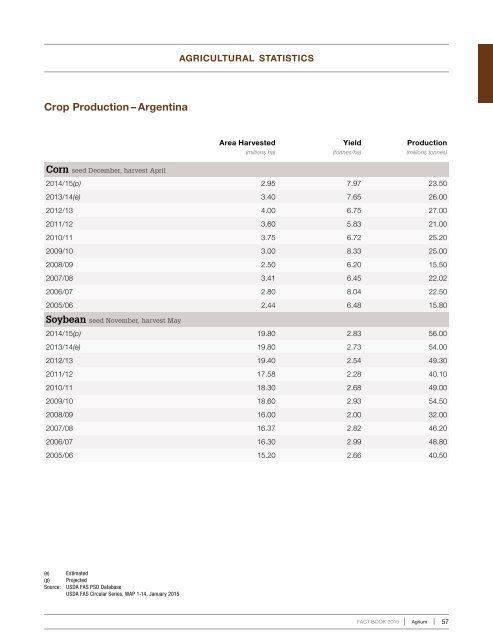
agricultural statisticsCrop Production – ArgentinaArea Harvested(millions ha)Yield(tonnes/ha)Production(millions tonnes)Corn seed December, harvest April<strong>2014</strong>/15(p) 2.95 7.97 23.502013/14(e) 3.40 7.65 26.002012/13 4.00 6.75 27.002011/12 3.60 5.83 21.002010/11 3.75 6.72 25.202009/10 3.00 8.33 25.002008/09 2.50 6.20 15.502007/08 3.41 6.45 22.022006/07 2.80 8.04 22.502005/06 2.44 6.48 15.80Soybean seed November, harvest May<strong>2014</strong>/15(p) 19.80 2.83 56.002013/14(e) 19.80 2.73 54.002012/13 19.40 2.54 49.302011/12 17.58 2.28 40.102010/11 18.30 2.68 49.002009/10 18.60 2.93 54.502008/09 16.00 2.00 32.002007/08 16.37 2.82 46.202006/07 16.30 2.99 48.802005/06 15.20 2.66 40.50(e) Estimated(p) ProjectedSource: USDA FAS PSD DatabaseUSDA FAS Circular Series, WAP 1-14, January <strong>2015</strong>FACT BOOK <strong>2015</strong>Agrium 57