2014-2015_factbook_2
2014-2015_factbook_2
2014-2015_factbook_2

You also want an ePaper? Increase the reach of your titles
YUMPU automatically turns print PDFs into web optimized ePapers that Google loves.
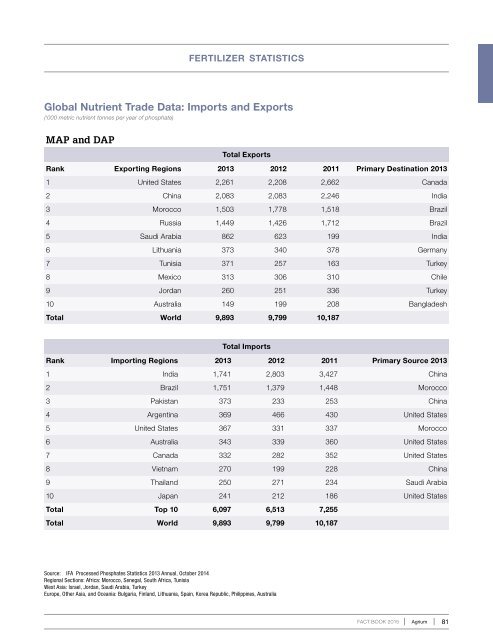
fertilizer statisticsGlobal Nutrient Trade Data: Imports and Exports(‘000 metric nutrient tonnes per year of phosphate)MAP and DAPTotal ExportsRank Exporting Regions 2013 2012 2011 Primary Destination 20131 United States 2,261 2,208 2,662 Canada2 China 2,083 2,083 2,246 India3 Morocco 1,503 1,778 1,518 Brazil4 Russia 1,449 1,426 1,712 Brazil5 Saudi Arabia 862 623 199 India6 Lithuania 373 340 378 Germany7 Tunisia 371 257 163 Turkey8 Mexico 313 306 310 Chile9 Jordan 260 251 336 Turkey10 Australia 149 199 208 BangladeshTotal World 9,893 9,799 10,187Total ImportsRank Importing Regions 2013 2012 2011 Primary Source 20131 India 1,741 2,803 3,427 China2 Brazil 1,751 1,379 1,448 Morocco3 Pakistan 373 233 253 China4 Argentina 369 466 430 United States5 United States 367 331 337 Morocco6 Australia 343 339 360 United States7 Canada 332 282 352 United States8 Vietnam 270 199 228 China9 Thailand 250 271 234 Saudi Arabia10 Japan 241 212 186 United StatesTotal Top 10 6,097 6,513 7,255Total World 9,893 9,799 10,187Source: IFA Processed Phosphates Statistics 2013 Annual, October <strong>2014</strong>Regional Sections: Africa: Morocco, Senegal, South Africa, TunisiaWest Asia: Israel, Jordan, Saudi Arabia, TurkeyEurope, Other Asia, and Oceania: Bulgaria, Finland, Lithuania, Spain, Korea Republic, Philippines, AustraliaFACT BOOK <strong>2015</strong>Agrium 81