2014-2015_factbook_2
2014-2015_factbook_2
2014-2015_factbook_2

You also want an ePaper? Increase the reach of your titles
YUMPU automatically turns print PDFs into web optimized ePapers that Google loves.
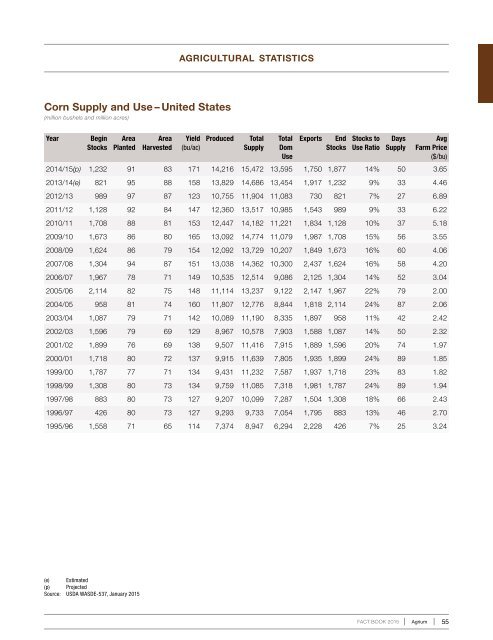
agricultural statisticsCorn Supply and Use – United States(million bushels and million acres)YearBeginStocksAreaPlantedAreaHarvestedYield(bu/ac)ProducedTotalSupplyTotalDomUseExportsEndStocksStocks toUse RatioDaysSupplyAvgFarm Price($/bu)<strong>2014</strong>/15(p) 1,232 91 83 171 14,216 15,472 13,595 1,750 1,877 14% 50 3.652013/14(e) 821 95 88 158 13,829 14,686 13,454 1,917 1,232 9% 33 4.462012/13 989 97 87 123 10,755 11,904 11,083 730 821 7% 27 6.892011/12 1,128 92 84 147 12,360 13,517 10,985 1,543 989 9% 33 6.222010/11 1,708 88 81 153 12,447 14,182 11,221 1,834 1,128 10% 37 5.182009/10 1,673 86 80 165 13,092 14,774 11,079 1,987 1,708 15% 56 3.552008/09 1,624 86 79 154 12,092 13,729 10,207 1,849 1,673 16% 60 4.062007/08 1,304 94 87 151 13,038 14,362 10,300 2,437 1,624 16% 58 4.202006/07 1,967 78 71 149 10,535 12,514 9,086 2,125 1,304 14% 52 3.042005/06 2,114 82 75 148 11,114 13,237 9,122 2,147 1,967 22% 79 2.002004/05 958 81 74 160 11,807 12,776 8,844 1,818 2,114 24% 87 2.062003/04 1,087 79 71 142 10,089 11,190 8,335 1,897 958 11% 42 2.422002/03 1,596 79 69 129 8,967 10,578 7,903 1,588 1,087 14% 50 2.322001/02 1,899 76 69 138 9,507 11,416 7,915 1,889 1,596 20% 74 1.972000/01 1,718 80 72 137 9,915 11,639 7,805 1,935 1,899 24% 89 1.851999/00 1,787 77 71 134 9,431 11,232 7,587 1,937 1,718 23% 83 1.821998/99 1,308 80 73 134 9,759 11,085 7,318 1,981 1,787 24% 89 1.941997/98 883 80 73 127 9,207 10,099 7,287 1,504 1,308 18% 66 2.431996/97 426 80 73 127 9,293 9,733 7,054 1,795 883 13% 46 2.701995/96 1,558 71 65 114 7,374 8,947 6,294 2,228 426 7% 25 3.24(e) Estimated(p) ProjectedSource: USDA WASDE-537, January <strong>2015</strong>FACT BOOK <strong>2015</strong>Agrium 55