2014-2015_factbook_2
2014-2015_factbook_2
2014-2015_factbook_2

Create successful ePaper yourself
Turn your PDF publications into a flip-book with our unique Google optimized e-Paper software.
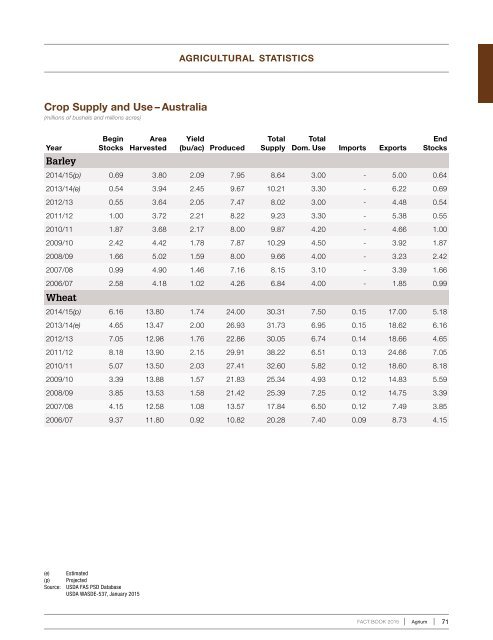
agricultural statisticsCrop Supply and Use – Australia(millions of bushels and millions acres)YearBarleyBeginStocksAreaHarvestedYield(bu/ac) ProducedTotalSupplyTotalDom. Use Imports ExportsEndStocks<strong>2014</strong>/15(p) 0.69 3.80 2.09 7.95 8.64 3.00 - 5.00 0.642013/14(e) 0.54 3.94 2.45 9.67 10.21 3.30 - 6.22 0.692012/13 0.55 3.64 2.05 7.47 8.02 3.00 - 4.48 0.542011/12 1.00 3.72 2.21 8.22 9.23 3.30 - 5.38 0.552010/11 1.87 3.68 2.17 8.00 9.87 4.20 - 4.66 1.002009/10 2.42 4.42 1.78 7.87 10.29 4.50 - 3.92 1.872008/09 1.66 5.02 1.59 8.00 9.66 4.00 - 3.23 2.422007/08 0.99 4.90 1.46 7.16 8.15 3.10 - 3.39 1.662006/07 2.58 4.18 1.02 4.26 6.84 4.00 - 1.85 0.99Wheat<strong>2014</strong>/15(p) 6.16 13.80 1.74 24.00 30.31 7.50 0.15 17.00 5.182013/14(e) 4.65 13.47 2.00 26.93 31.73 6.95 0.15 18.62 6.162012/13 7.05 12.98 1.76 22.86 30.05 6.74 0.14 18.66 4.652011/12 8.18 13.90 2.15 29.91 38.22 6.51 0.13 24.66 7.052010/11 5.07 13.50 2.03 27.41 32.60 5.82 0.12 18.60 8.182009/10 3.39 13.88 1.57 21.83 25.34 4.93 0.12 14.83 5.592008/09 3.85 13.53 1.58 21.42 25.39 7.25 0.12 14.75 3.392007/08 4.15 12.58 1.08 13.57 17.84 6.50 0.12 7.49 3.852006/07 9.37 11.80 0.92 10.82 20.28 7.40 0.09 8.73 4.15(e) Estimated(p) ProjectedSource: USDA FAS PSD DatabaseUSDA WASDE-537, January <strong>2015</strong>FACT BOOK <strong>2015</strong>Agrium 71