2014-2015_factbook_2
2014-2015_factbook_2
2014-2015_factbook_2

You also want an ePaper? Increase the reach of your titles
YUMPU automatically turns print PDFs into web optimized ePapers that Google loves.
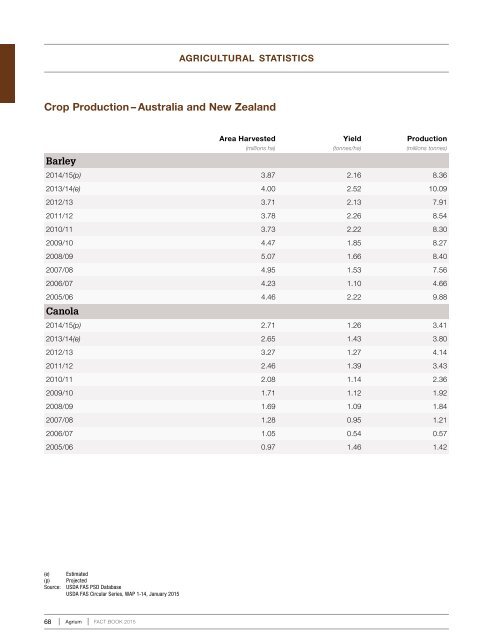
agricultural statisticsCrop Production – Australia and New ZealandBarleyArea HarvestedYieldProduction(millions ha)(tonnes/ha)(millions tonnes)<strong>2014</strong>/15(p) 3.87 2.16 8.362013/14(e) 4.00 2.52 10.092012/13 3.71 2.13 7.912011/12 3.78 2.26 8.542010/11 3.73 2.22 8.302009/10 4.47 1.85 8.272008/09 5.07 1.66 8.402007/08 4.95 1.53 7.562006/07 4.23 1.10 4.662005/06 4.46 2.22 9.88Canola<strong>2014</strong>/15(p) 2.71 1.26 3.412013/14(e) 2.65 1.43 3.802012/13 3.27 1.27 4.142011/12 2.46 1.39 3.432010/11 2.08 1.14 2.362009/10 1.71 1.12 1.922008/09 1.69 1.09 1.842007/08 1.28 0.95 1.212006/07 1.05 0.54 0.572005/06 0.97 1.46 1.42(e) Estimated(p) ProjectedSource: USDA FAS PSD DatabaseUSDA FAS Circular Series, WAP 1-14, January <strong>2015</strong>68 Agrium FACT BOOK <strong>2015</strong>