2014-2015_factbook_2
2014-2015_factbook_2
2014-2015_factbook_2

You also want an ePaper? Increase the reach of your titles
YUMPU automatically turns print PDFs into web optimized ePapers that Google loves.
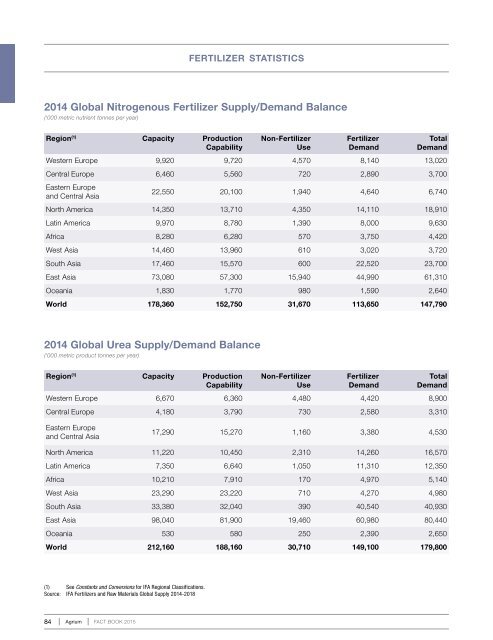
fertilizer statistics<strong>2014</strong> Global Nitrogenous Fertilizer Supply/Demand Balance(‘000 metric nutrient tonnes per year)Region (1) Capacity ProductionCapabilityNon-FertilizerUseFertilizerDemandTotalDemandWestern Europe 9,920 9,720 4,570 8,140 13,020Central Europe 6,460 5,560 720 2,890 3,700Eastern Europeand Central Asia22,550 20,100 1,940 4,640 6,740North America 14,350 13,710 4,350 14,110 18,910Latin America 9,970 8,780 1,390 8,000 9,630Africa 8,280 6,280 570 3,750 4,420West Asia 14,460 13,960 610 3,020 3,720South Asia 17,460 15,570 600 22,520 23,700East Asia 73,080 57,300 15,940 44,990 61,310Oceania 1,830 1,770 980 1,590 2,640World 178,360 152,750 31,670 113,650 147,790<strong>2014</strong> Global Urea Supply/Demand Balance(‘000 metric product tonnes per year)Region (1) Capacity ProductionCapabilityNon-FertilizerUseFertilizerDemandTotalDemandWestern Europe 6,670 6,360 4,480 4,420 8,900Central Europe 4,180 3,790 730 2,580 3,310Eastern Europeand Central Asia17,290 15,270 1,160 3,380 4,530North America 11,220 10,450 2,310 14,260 16,570Latin America 7,350 6,640 1,050 11,310 12,350Africa 10,210 7,910 170 4,970 5,140West Asia 23,290 23,220 710 4,270 4,980South Asia 33,380 32,040 390 40,540 40,930East Asia 98,040 81,900 19,460 60,980 80,440Oceania 530 580 250 2,390 2,650World 212,160 188,160 30,710 149,100 179,800(1) See Constants and Conversions for IFA Regional Classifications.Source: IFA Fertilizers and Raw Materials Global Supply <strong>2014</strong>-201884 Agrium FACT BOOK <strong>2015</strong>