2014-2015_factbook_2
2014-2015_factbook_2
2014-2015_factbook_2

Create successful ePaper yourself
Turn your PDF publications into a flip-book with our unique Google optimized e-Paper software.
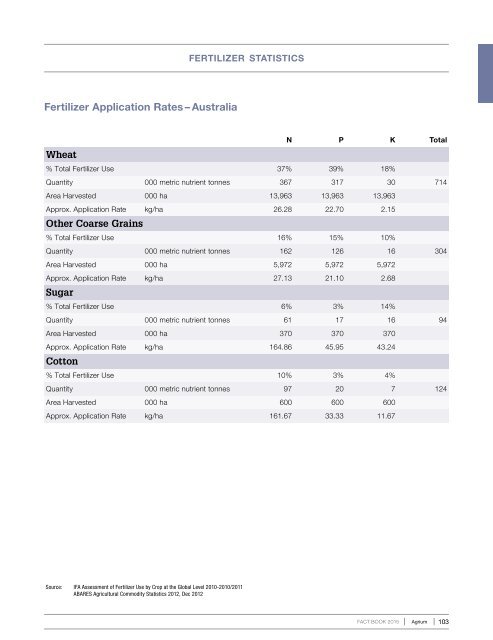
fertilizer statisticsFertilizer Application Rates – AustraliaWheatN P K Total% Total Fertilizer Use 37% 39% 18%Quantity 000 metric nutrient tonnes 367 317 30 714Area Harvested 000 ha 13,963 13,963 13,963Approx. Application Rate kg/ha 26.28 22.70 2.15Other Coarse Grains% Total Fertilizer Use 16% 15% 10%Quantity 000 metric nutrient tonnes 162 126 16 304Area Harvested 000 ha 5,972 5,972 5,972Approx. Application Rate kg/ha 27.13 21.10 2.68Sugar% Total Fertilizer Use 6% 3% 14%Quantity 000 metric nutrient tonnes 61 17 16 94Area Harvested 000 ha 370 370 370Approx. Application Rate kg/ha 164.86 45.95 43.24Cotton% Total Fertilizer Use 10% 3% 4%Quantity 000 metric nutrient tonnes 97 20 7 124Area Harvested 000 ha 600 600 600Approx. Application Rate kg/ha 161.67 33.33 11.67Source: IFA Assessment of Fertilizer Use by Crop at the Global Level 2010-2010/2011ABARES Agricultural Commodity Statistics 2012, Dec 2012FACT BOOK <strong>2015</strong>Agrium 103