2014-2015_factbook_2
2014-2015_factbook_2
2014-2015_factbook_2

You also want an ePaper? Increase the reach of your titles
YUMPU automatically turns print PDFs into web optimized ePapers that Google loves.
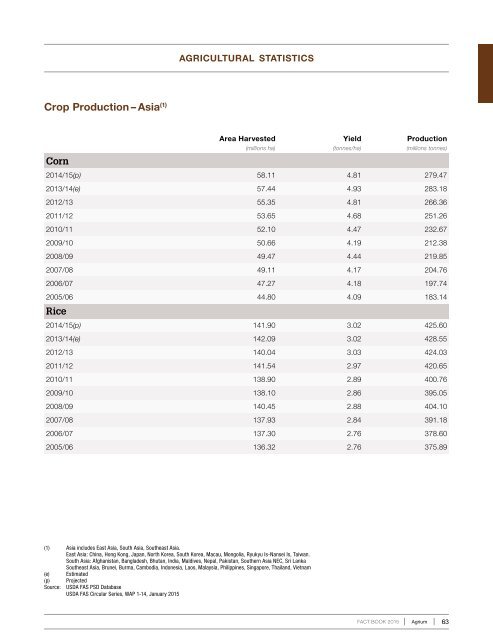
agricultural statisticsCrop Production – Asia (1)CornArea HarvestedYieldProduction(millions ha)(tonnes/ha)(millions tonnes)<strong>2014</strong>/15(p) 58.11 4.81 279.472013/14(e) 57.44 4.93 283.182012/13 55.35 4.81 266.362011/12 53.65 4.68 251.262010/11 52.10 4.47 232.672009/10 50.66 4.19 212.382008/09 49.47 4.44 219.852007/08 49.11 4.17 204.762006/07 47.27 4.18 197.742005/06 44.80 4.09 183.14Rice<strong>2014</strong>/15(p) 141.90 3.02 425.602013/14(e) 142.09 3.02 428.552012/13 140.04 3.03 424.032011/12 141.54 2.97 420.652010/11 138.90 2.89 400.762009/10 138.10 2.86 395.052008/09 140.45 2.88 404.102007/08 137.93 2.84 391.182006/07 137.30 2.76 378.602005/06 136.32 2.76 375.89(1) Asia includes East Asia, South Asia, Southeast Asia.East Asia: China, Hong Kong, Japan, North Korea, South Korea, Macau, Mongolia, Ryukyu Is-Nansei Is, Taiwan.South Asia: Afghanistan, Bangladesh, Bhutan, India, Maldives, Nepal, Pakistan, Southern Asia NEC, Sri LankaSoutheast Asia, Brunei, Burma, Cambodia, Indonesia, Laos, Malaysia, Philippines, Singapore, Thailand, Vietnam(e) Estimated(p) ProjectedSource: USDA FAS PSD DatabaseUSDA FAS Circular Series, WAP 1-14, January <strong>2015</strong>FACT BOOK <strong>2015</strong>Agrium 63