2014-2015_factbook_2
2014-2015_factbook_2
2014-2015_factbook_2

Create successful ePaper yourself
Turn your PDF publications into a flip-book with our unique Google optimized e-Paper software.
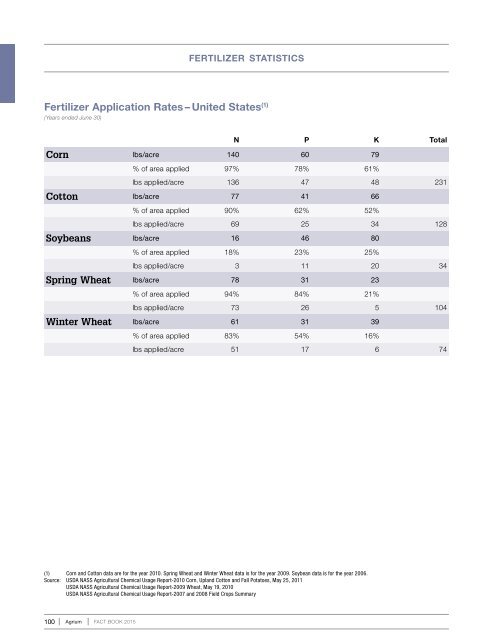
fertilizer statisticsFertilizer Application Rates – United States (1)(Years ended June 30)N P K TotalCorn lbs/acre 140 60 79% of area applied 97% 78% 61%lbs applied/acre 136 47 48 231Cotton lbs/acre 77 41 66% of area applied 90% 62% 52%lbs applied/acre 69 25 34 128Soybeans lbs/acre 16 46 80% of area applied 18% 23% 25%lbs applied/acre 3 11 20 34Spring Wheat lbs/acre 78 31 23% of area applied 94% 84% 21%lbs applied/acre 73 26 5 104Winter Wheat lbs/acre 61 31 39% of area applied 83% 54% 16%lbs applied/acre 51 17 6 74(1) Corn and Cotton data are for the year 2010. Spring Wheat and Winter Wheat data is for the year 2009. Soybean data is for the year 2006.Source: USDA NASS Agricultural Chemical Usage Report-2010 Corn, Upland Cotton and Fall Potatoes, May 25, 2011USDA NASS Agricultural Chemical Usage Report-2009 Wheat, May 19, 2010USDA NASS Agricultural Chemical Usage Report-2007 and 2008 Field Crops Summary100 Agrium FACT BOOK <strong>2015</strong>