2014-2015_factbook_2
2014-2015_factbook_2
2014-2015_factbook_2

You also want an ePaper? Increase the reach of your titles
YUMPU automatically turns print PDFs into web optimized ePapers that Google loves.
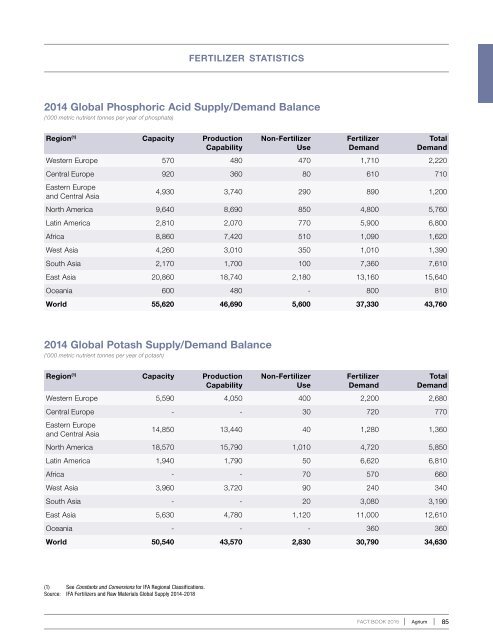
fertilizer statistics<strong>2014</strong> Global Phosphoric Acid Supply/Demand Balance(‘000 metric nutrient tonnes per year of phosphate)Region (1) Capacity ProductionCapabilityNon-FertilizerUseFertilizerDemandTotalDemandWestern Europe 570 480 470 1,710 2,220Central Europe 920 360 80 610 710Eastern Europeand Central Asia4,930 3,740 290 890 1,200North America 9,640 8,690 850 4,800 5,760Latin America 2,810 2,070 770 5,900 6,800Africa 8,860 7,420 510 1,090 1,620West Asia 4,260 3,010 350 1,010 1,390South Asia 2,170 1,700 100 7,360 7,610East Asia 20,860 18,740 2,180 13,160 15,640Oceania 600 480 - 800 810World 55,620 46,690 5,600 37,330 43,760<strong>2014</strong> Global Potash Supply/Demand Balance(‘000 metric nutrient tonnes per year of potash)Region (1) Capacity ProductionCapabilityNon-FertilizerUseFertilizerDemandTotalDemandWestern Europe 5,590 4,050 400 2,200 2,680Central Europe - - 30 720 770Eastern Europeand Central Asia14,850 13,440 40 1,280 1,360North America 18,570 15,790 1,010 4,720 5,850Latin America 1,940 1,790 50 6,620 6,810Africa - - 70 570 660West Asia 3,960 3,720 90 240 340South Asia - - 20 3,080 3,190East Asia 5,630 4,780 1,120 11,000 12,610Oceania - - - 360 360World 50,540 43,570 2,830 30,790 34,630(1) See Constants and Conversions for IFA Regional Classifications.Source: IFA Fertilizers and Raw Materials Global Supply <strong>2014</strong>-2018FACT BOOK <strong>2015</strong>Agrium 85