2014-2015_factbook_2
2014-2015_factbook_2
2014-2015_factbook_2

Create successful ePaper yourself
Turn your PDF publications into a flip-book with our unique Google optimized e-Paper software.
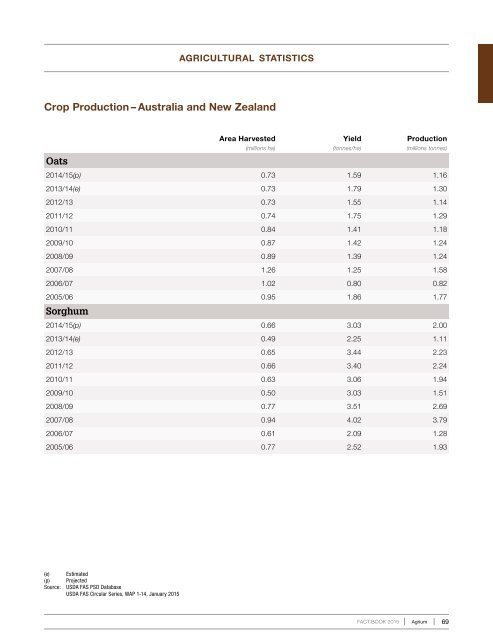
agricultural statisticsCrop Production – Australia and New ZealandOatsArea HarvestedYieldProduction(millions ha)(tonnes/ha)(millions tonnes)<strong>2014</strong>/15(p) 0.73 1.59 1.162013/14(e) 0.73 1.79 1.302012/13 0.73 1.55 1.142011/12 0.74 1.75 1.292010/11 0.84 1.41 1.182009/10 0.87 1.42 1.242008/09 0.89 1.39 1.242007/08 1.26 1.25 1.582006/07 1.02 0.80 0.822005/06 0.95 1.86 1.77Sorghum<strong>2014</strong>/15(p) 0.66 3.03 2.002013/14(e) 0.49 2.25 1.112012/13 0.65 3.44 2.232011/12 0.66 3.40 2.242010/11 0.63 3.06 1.942009/10 0.50 3.03 1.512008/09 0.77 3.51 2.692007/08 0.94 4.02 3.792006/07 0.61 2.09 1.282005/06 0.77 2.52 1.93(e) Estimated(p) ProjectedSource: USDA FAS PSD DatabaseUSDA FAS Circular Series, WAP 1-14, January <strong>2015</strong>FACT BOOK <strong>2015</strong>Agrium 69