Shodex Catalogue 2013-2015.pdf - Analytics Shop
Shodex Catalogue 2013-2015.pdf - Analytics Shop
Shodex Catalogue 2013-2015.pdf - Analytics Shop

Create successful ePaper yourself
Turn your PDF publications into a flip-book with our unique Google optimized e-Paper software.
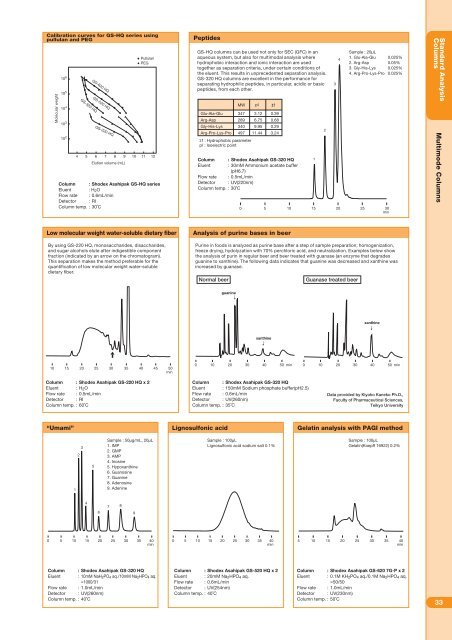
Calibration curves for GS-HQ series usingpullulan and PEGMolecular weight10 510 410 310 2 4 5 6 7 8 9 10 11 1210 6 Elution volume (mL)GS-320 HQGS-620 HQGS-520 HQGS-220 HQPullulanPEGColumn : <strong>Shodex</strong> Asahipak GS-HQ seriesEluent : H 2 OFlow rate : 0.6mL/minDetector : RIColumn temp. : 30˚CPeptidesGS-HQ columns can be used not only for SEC (GFC) in anaqueous system, but also for multimodal analysis wherehydrophobic interaction and ionic interaction are usedtogether as separation criteria, under certain conditions ofthe eluent. This results in unprecedented separation analysis.GS-320 HQ columns are excellent in the performance forseparating hydrophilic peptides, in particular, acidic or basicpeptides, from each other.MWGlu-Ala-Glu 347 3.12Arg-Asp289 6.75Gly-His-Lys 340 9.95Arg-Pro-Lys-Pro 497 11.44Σf : Hydrophobic parameterpl : Isoelectric pointColumn : <strong>Shodex</strong> Asahipak GS-320 HQEluent : 30mM Ammonium acetate buffer(pH6.7)Flow rate : 0.5mL/minDetector : UV(220nm)Column temp. : 30˚CplΣf0.390.680.293.240 5 101234Sample : 20μL1. Glu-Ala-Glu 0.025%2. Arg-Asp 0.05%3. Gly-His-Lys 0.025%4. Arg-Pro-Lys-Pro 0.025%15 20 25 30minStandard AnalysisColumnsMultimode ColumnsLow molecular weight water-soluble dietary fiberBy using GS-220 HQ, monosaccharides, disaccharides,and sugar alcohols elute after indigestible componentfraction (indicated by an arrow on the chromatogram).This separation makes the method preferable for thequantification of low molecular weight water-solubledietary fiber.Analysis of purine bases in beerPurine in foods is analyzed as purine base after a step of sample preparation; homogenization,freeze drying, hydolyzation with 70% perchloric acid, and neutralization. Examples below showthe analysis of purin in regular beer and beer treated with guanase (an enzyme that degradesguanine to xanthine). The following data indicates that guanine was decreased and xanthine wasincreased by guanase.Normal beerGuanase treated beerguaninexanthinexanthine1015 20 25 30 35 40 45 50min010 20 30 40 50 min 0 10 20 30 40 50 minColumn : <strong>Shodex</strong> Asahipak GS-220 HQ x 2Eluent : H 2 OFlow rate : 0.5mL/minDetector : RIColumn temp. : 60˚CColumn : <strong>Shodex</strong> Asahipak GS-320 HQEluent : 150mM Sodium phosphate buffer(pH2.5)Flow rate : 0.6mL/minDetector : UV(260nm)Column temp. : 35˚CData provided by Kiyoko Kaneko Ph.D.,Faculty of Pharmaceutical Sciences,Teikyo University“Umami”Lignosulfonic acidGelatin analysis with PAGI method1235Sample : 50μg/mL, 20μL1. IMP2. GMP3. AMP4. Inosine5. Hypoxanthine6. Guanosine7. Guanine8. Adenosine9. AdenineSample : 100μLLignosulfonic acid sodium salt 0.1%Sample : 100μLGelatin(Koepff 16922) 0.2%467 890 5 10 15 20 25 30 35 40min0 5 10 15 20 25 30 35 40min5 10 15 20 25 30 3540minColumn : <strong>Shodex</strong> Asahipak GS-320 HQEluent : 10mM NaH 2 PO 4 aq./10mM Na 2 HPO 4 aq.=1000/31Flow rate : 1.0mL/minDetector : UV(260nm)Column temp. : 40˚CColumn : <strong>Shodex</strong> Asahipak GS-520 HQ x 2Eluent : 20mM Na 2 HPO 4 aq.Flow rate : 0.6mL/minDetector : UV(254nm)Column temp. : 40˚CColumn : <strong>Shodex</strong> Asahipak GS-620 7G-P x 2Eluent : 0.1M KH 2 PO 4 aq./0.1M Na 2 HPO 4 aq.=50/50Flow rate : 1.0mL/minDetector : UV(230nm)Column temp. : 50˚C33