GPG Report & Accounts 2003 - Guinness Peat Group plc
GPG Report & Accounts 2003 - Guinness Peat Group plc
GPG Report & Accounts 2003 - Guinness Peat Group plc
- No tags were found...

Create successful ePaper yourself
Turn your PDF publications into a flip-book with our unique Google optimized e-Paper software.
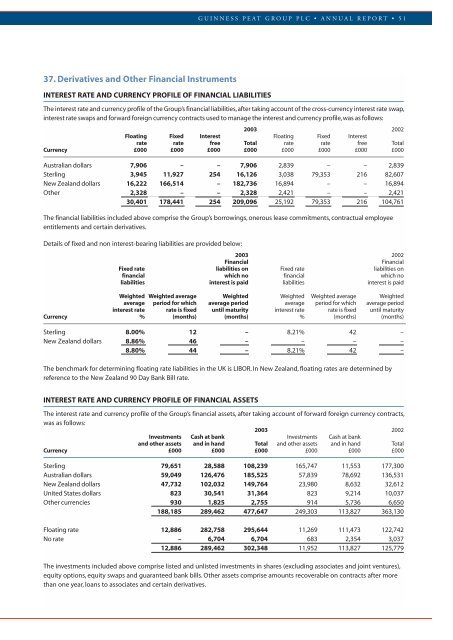
GUINNESS PEAT GROUP PLC • ANNUAL REPORT • 5137. Derivatives and Other Financial InstrumentsINTEREST RATE AND CURRENCY PROFILE OF FINANCIAL LIABILITIESThe interest rate and currency profile of the <strong>Group</strong>’s financial liabilities,after taking account of the cross-currency interest rate swap,interest rate swaps and forward foreign currency contracts used to manage the interest and currency profile,was as follows:<strong>2003</strong> 2002Floating Fixed Interest Floating Fixed Interestrate rate free Total rate rate free TotalCurrency £000 £000 £000 £000 £000 £000 £000 £000Australian dollars 7,906 – – 7,906 2,839 – – 2,839Sterling 3,945 11,927 254 16,126 3,038 79,353 216 82,607New Zealand dollars 16,222 166,514 – 182,736 16,894 – – 16,894Other 2,328 – – 2,328 2,421 – – 2,42130,401 178,441 254 209,096 25,192 79,353 216 104,761The financial liabilities included above comprise the <strong>Group</strong>’s borrowings, onerous lease commitments, contractual employeeentitlements and certain derivatives.Details of fixed and non interest-bearing liabilities are provided below:<strong>2003</strong> 2002FinancialFinancialFixed rate liabilities on Fixed rate liabilities onfinancial which no financial which noliabilities interest is paid liabilities interest is paidWeighted Weighted average Weighted Weighted Weighted average Weightedaverage period for which average period average period for which average periodinterest rate rate is fixed until maturity interest rate rate is fixed until maturityCurrency % (months) (months) % (months) (months)Sterling 8.00% 12 – 8.21% 42 –New Zealand dollars 8.86% 46 – – – –8.80% 44 – 8.21% 42 –The benchmark for determining floating rate liabilities in the UK is LIBOR. In New Zealand, floating rates are determined byreference to the New Zealand 90 Day Bank Bill rate.INTEREST RATE AND CURRENCY PROFILE OF FINANCIAL ASSETSThe interest rate and currency profile of the <strong>Group</strong>’s financial assets, after taking account of forward foreign currency contracts,was as follows:<strong>2003</strong> 2002Investments Cash at bank Investments Cash at bankand other assets and in hand Total and other assets and in hand TotalCurrency £000 £000 £000 £000 £000 £000Sterling 79,651 28,588 108,239 165,747 11,553 177,300Australian dollars 59,049 126,476 185,525 57,839 78,692 136,531New Zealand dollars 47,732 102,032 149,764 23,980 8,632 32,612United States dollars 823 30,541 31,364 823 9,214 10,037Other currencies 930 1,825 2,755 914 5,736 6,650188,185 289,462 477,647 249,303 113,827 363,130Floating rate 12,886 282,758 295,644 11,269 111,473 122,742No rate – 6,704 6,704 683 2,354 3,03712,886 289,462 302,348 11,952 113,827 125,779The investments included above comprise listed and unlisted investments in shares (excluding associates and joint ventures),equity options, equity swaps and guaranteed bank bills. Other assets comprise amounts recoverable on contracts after morethan one year, loans to associates and certain derivatives.